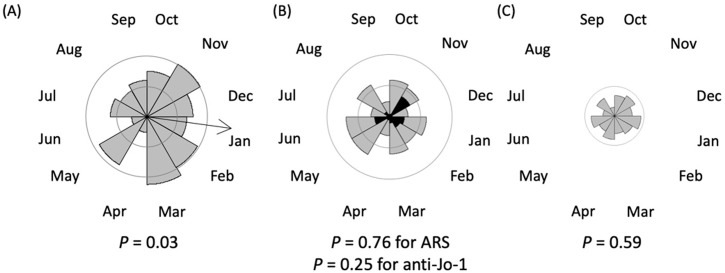
Figure 1.
Seasonality analysis. Rose diagrams of the Rayleigh test showing the number of patients categorised by months of disease onset. The radius of each sector of the circle indicates the number of patients. Inside and outside circles represent 10 and 20 cases, respectively. An arrow indicates the mean direction of the circular data for significant seasonality. (A) Anti-MDA5-positive patients. (B) Anti-ARS-positive patients. Black sectors indicate numbers of patients with anti-Jo-1 antibody. (C) Anti-MDA5-/ARS-negative patients.
ARS, aminoacyl tRNA synthetase; MDA5, melanoma differentiation-associated gene 5.

