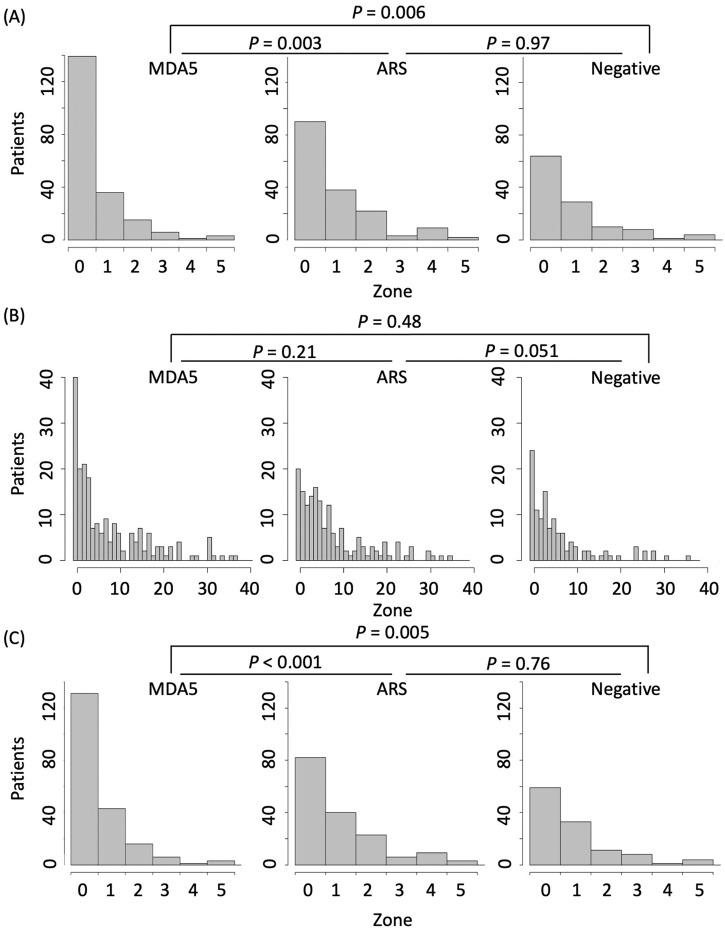
Figure 2.
Distance from residential place to the nearest waterfront. Histograms showing the number of patients hierarchised by the distance from the residential place at disease onset to the nearest waterfront. The distance was categorised by multiplication of 1.75 km. Zone 0 covers the distance from 0 to 1.75 km, while Zone 1 covers the distance from 1.75 to 3.50 km. P values were calculated by exact Wilcoxon rank-sum test. (A) Distance to any waterfront. (B) Distance to seawater. (C) Distance to freshwater (river, lake or pond).

