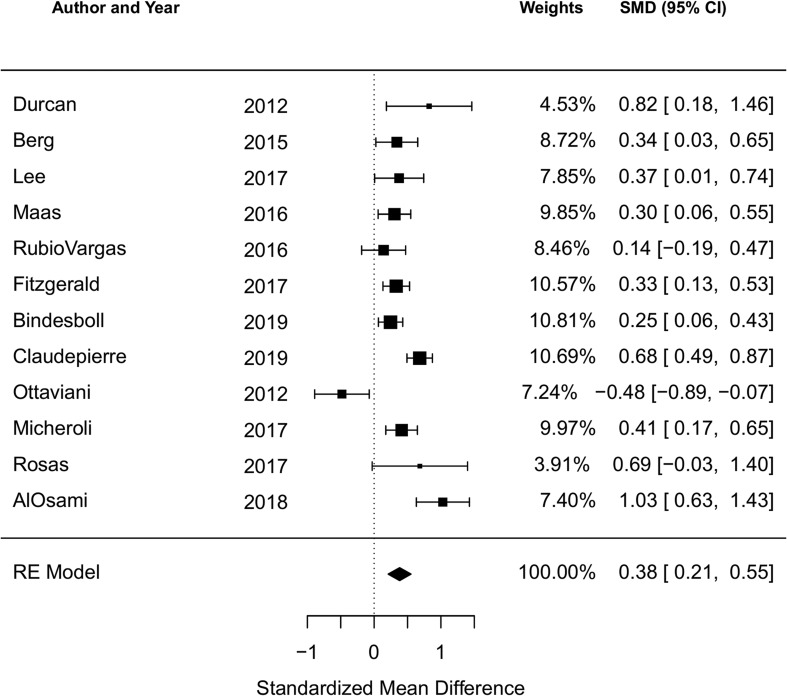
Figure 2.
Forest plot for the standardised mean difference in the BASDAI comparing obese or overweight/obese BMI to normal BMI in cross-sectional and cohort studies.
Negative SMDs indicate the association of higher BMI with lower BASDAI; positive SMDs indicate: the association of higher BMI with higher BASDAI.
BASDAI, Bath Ankylosing Spondylitis Disease Activity Index; BMI, body mass index; SMD, standardised mean difference.

