
Figure 3.
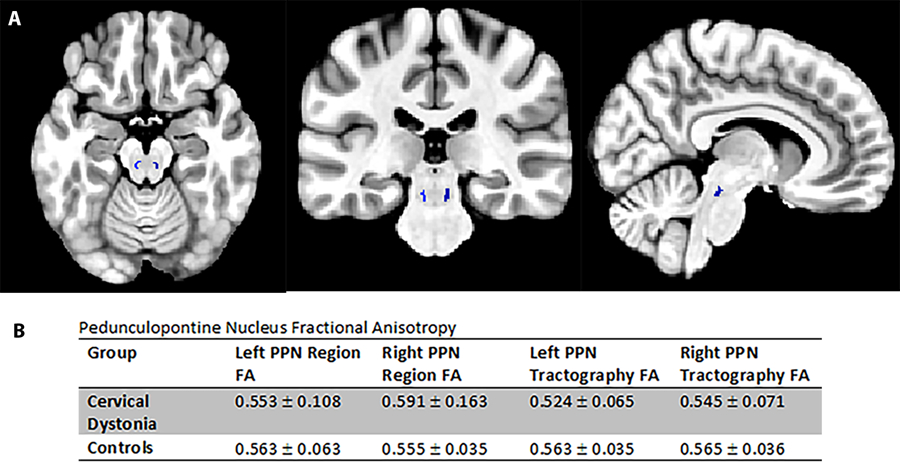
Pedunculopontine Nucleus Diffusion Tensor Imaging
A. Axial, coronal and sagittal brain MRI in MNI space showing the location of the pedunculopontine nucleus (PPN) in blue; B. This table shows fractional anistropy values in and around the PPN in CD and control subjects. There is no difference between the groups.