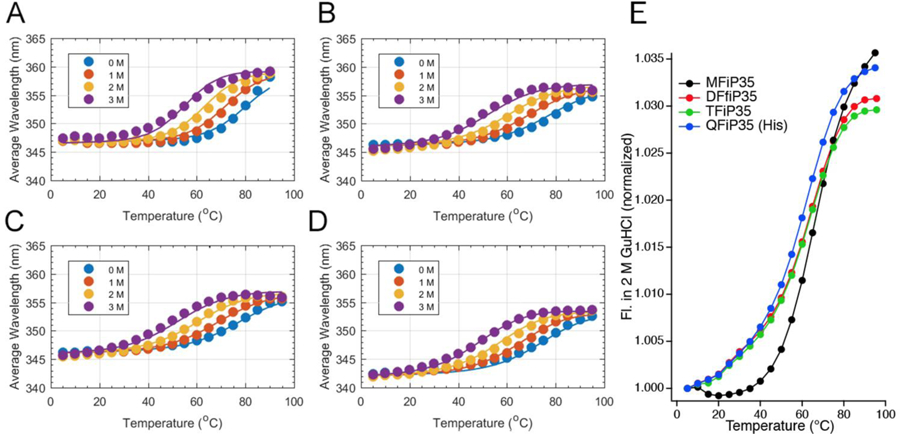
Fig. 3.

Global fitting (A-D) of the thermal melts at different GuHCl concentrations and comparison at 2 M GuHCl (E). (A) MFiP35; (B) DFiP35; (C) TFiP(35); (D) QFiP35 expressed with a His tag. The curves are from the global multi-domain model fit of all thermodynamic and kinetic data of all n-mers, assuming three states per domain. (E) Comparison of the data at 2 M GuHCl, with connected data points to guide the eye Tm changes M>D,T>Q.
