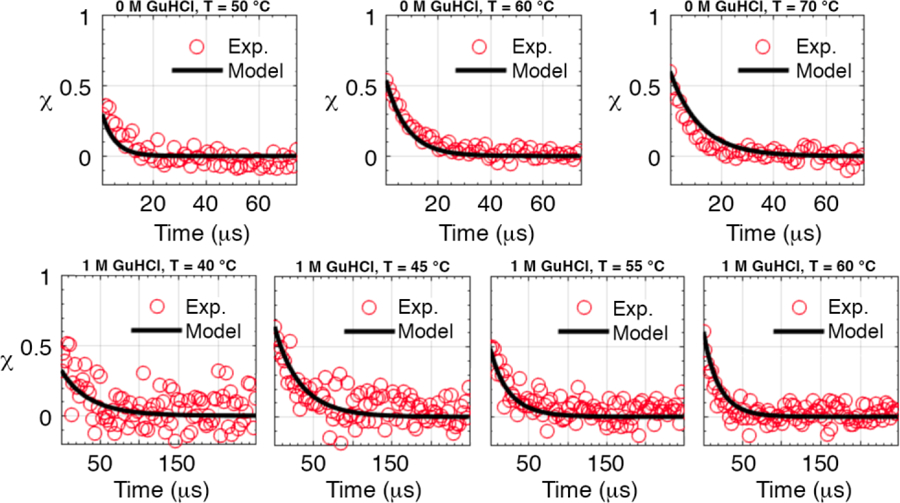
Fig. 5.

Representative plots for temperature jump relaxation kinetics. χ(t) vs. time traces are fitted using the global fitting model for the monomer MFiP35 (top) and tetramer QFiP35 with histidine tag purification (bottom). The other proteins are shown in Supplementary Information section 6 in Figures S6a–b. The black curves are from a global fit of all thermodynamic and kinetic data of all n-mers simultaneously.
