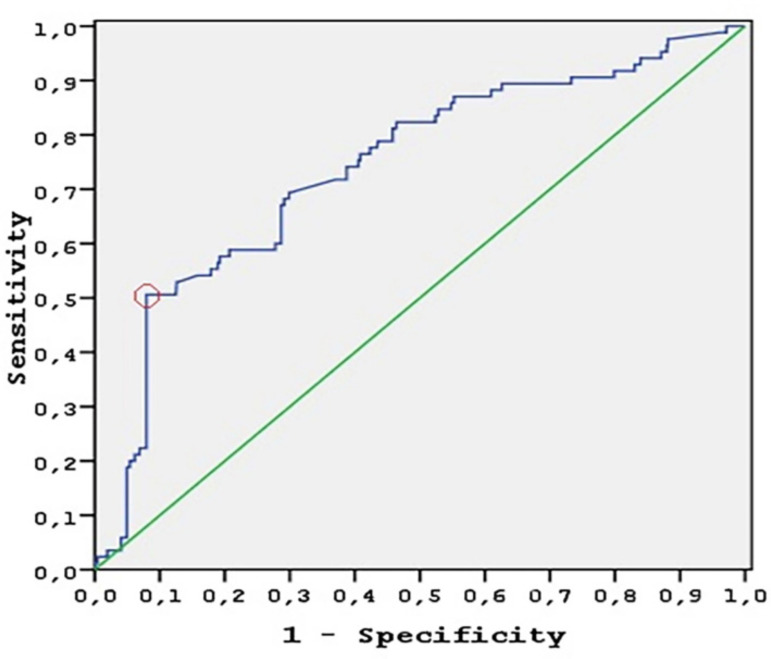
Fig. 2.
ROC curve analysis. The diagonal represents the no-effect line (AUC=0.50), with curves above this line representing increasing diagnostic accuracy. NLR accurately predicted MACCE (AUC=0.74). The circle represents the optimal cut-off to predict MACCE with a sensitivity of 50.6% and specificity of 92%. AUC=area under the curve

