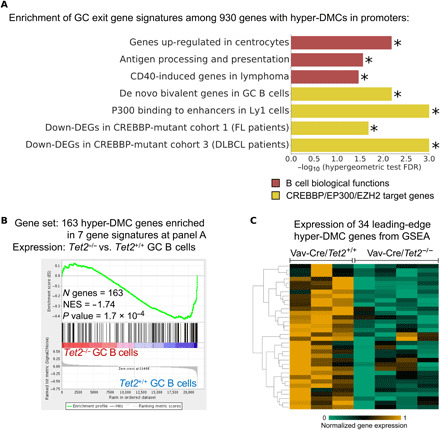
Fig. 3. Hypermethylation affects key pathways in B cell biology.

(A) Result of pathway enrichment analysis of the 930 genes with hyper-DMCs in their promoter regions. Plot shows minus log10 of the FDR scores for the enrichment of genes in seven functional categories important in GC or DLBCL biology. FDR scores were computed using hypergeometric test for these 930 genes. (B) GSEA enrichment plots in Vav-Cre/Tet2−/− versus Vav-Cre/Tet2+/+ GC B cells, against 163 genes with hyper-DMCs in their promoter regions, which were enriched for pathways listed in (A). (C) Row-normalized gene expression of 34 genes, which were identified as “leading-edge genes” in the GSEA analysis shown in (B). Yellow represents high expression, and green represents low expression. NES, normalized enrichment score; Down-DEGs, down-regulated genes; FL, follicular lymphoma. Star (*) indicates the value of FDR below 0.05.
