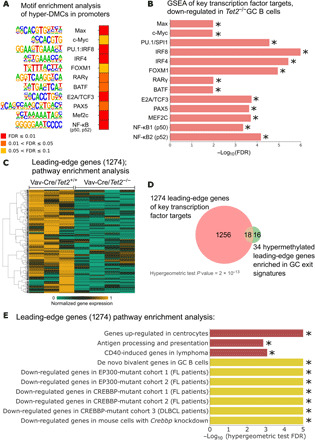
Fig. 4. Hypermethylated regions are enriched for binding motives of key TFs in B cell biology.

(A) Heatmap of the FDR scores of the motif enrichment analysis conducted using Homer for hyper-DMCs (±50 bp) located in promoter regions. Each TF name is accompanied by a logo sequence of the binding site. (B) Minus log10 of the FDR scores for enrichment of the target genes of 13 TFs, the binding sites of which were identified as hyper-methylated in Tet2−/− GC B cells. FDR scores were computed using GSEA, as described in Materials and Methods. Direction of the enrichment is biased toward Vav-Cre/Tet2+/+ GC B cells, when compared with Vav-Cre/Tet2−/− GC B cells (i.e., target genes are down-regulated in Tet2−/− GC B cells). (C) Normalized gene expression of the 1274 genes identified as leading-edge genes in at least 1 of 13 significantly enriched gene sets shown in (B). (D) Overlap between the 1274 leading-edge genes and 34 hypermethylated leading-edge genes of seven gene signatures important in GC exit or B cell biology. (E) Minus log10 of the FDR scores for the enrichment of 10 gene sets important in B cell biology. FDR scores were computed using hypergeometric test for leading-edge genes presented in (C) and (D). Star (*) indicates the value of FDR below 0.05.
