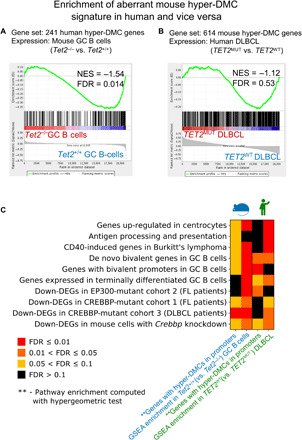
Fig. 7. TET2 loss of function in human DLBCL manifest Tet2-deficient GC DMC and gene signature.

(A) Enrichment of the aberrant human TET2MUT gene signature (241 genes with hyper-DMCs in their promoters) in mouse Tet2−/− versus Tet2+/+ GC B cells. (B) Enrichment of the aberrant mouse Tet2−/− gene signature (614 genes with hyper-DMCs in their promoters) in human TET2MUT versus TET2WT DLBCL. (C) First and third columns of the heatmap represent the results of pathway enrichment analysis of 614 mouse and 241 human genes with hyper-DMCs in their promoters, respectively. FDR scores for these results were computed using hypergeometric test. Second and fourth columns represent the results of pathway enrichment analysis of the same gene sets, using GSEA in mouse Tet2−/− versus Tet2+/+ GC B cells and human TET2MUT versus TET2WT DLBCL, respectively. NES scores of all pathways in mouse and human are biased toward Tet2−/−/TET2WT.
