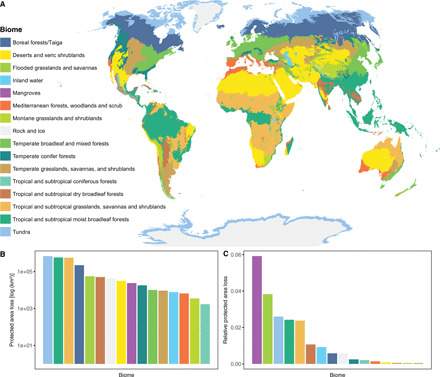
Fig. 4. PA loss across biomes.

Global distribution of biomes (A) and expected total loss in area protected (B) and loss in area protected relative to biome size (C) based on differences in protected climate space with respect to current climate. Plots in (B) and (C) are ranked by total and relative loss, respectively (see Materials and Methods for details of loss calculations).
