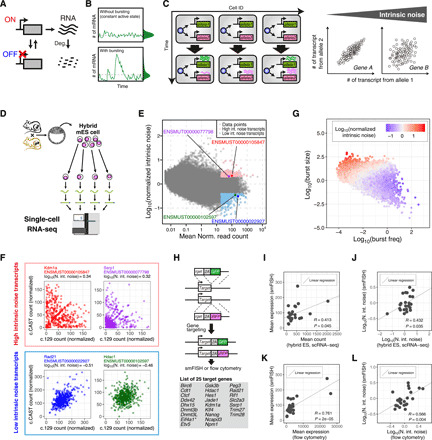
Fig. 1. Genome-wide analysis of the kinetic properties of transcriptional bursting.

(A) Schematic diagram of gene expression with stochastic switching between ON and OFF states. (B) Schematic representations of the dynamics of transcript levels of a gene with or without transcriptional bursting. (C) Transcriptional bursting induces inter-allelic and intercellular heterogeneity in gene expression (left). Scatter plots of the individual allele-derived transcript numbers (right). (D) Schematic representation of scRNA-seq using hybrid mESCs. (E) Scatter plot of mean normalized read counts and normalized intrinsic noise of individual transcripts revealed by scRNA-seq. (F) Representative scatter plots of normalized individual allelic read counts of high and low intrinsic noise transcripts. N. int. noise, normalized intrinsic noise. (G) Scatter plot of burst size and burst frequency of individual transcripts. (H) Schematic representation of KI of GFP and iRFP gene cassette into individual alleles of mESC derived from inbred mice. Targeted genes are listed in the lower panel. Asterisks indicate genes in which KI cassettes were inserted immediately downstream of the start codon. (I to L) Scatter plots of the mean number of transcripts of targeted genes in KI cell lines counted by smFISH versus mean normalized read counts of corresponding genes in hybrid mESCs revealed by scRNA-seq (I) or versus mean expression levels of targeted genes in KI cell lines revealed by flow cytometry (K). Scatter plots of normalized intrinsic noise of targeted gene transcripts in KI cell lines revealed by smFISH versus that of corresponding genes in hybrid mESCs revealed by scRNA-seq (J) or versus that of targeted genes in KI cell lines revealed by flow cytometry (L).
