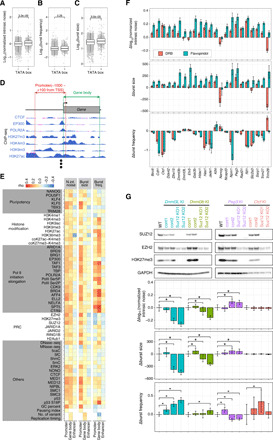
Fig. 2. Exploring molecular determinants of transcriptional bursting.

(A to C) Kinetic properties of transcriptional bursting of genes either with or without a TATA box. (D) Schematic representation of calculating reads per million (RPM) at the promoter and gene body from ChIP-seq data. In addition, similar calculations were also performed for enhancers (see Materials and Methods). (E) Heat maps of Spearman’s rank correlation between promoter-, gene body–, or enhancer-associated factors and either normalized intrinsic noise (N. int. noise), burst size, or burst frequency (burst freq.). (F) Effect of the Pol II pause release inhibitor, DRB, and flavopiridol treatment on the kinetic properties of transcriptional bursting. Δnormalized intrinsic noise, Δburst size, and Δburst frequency are residuals of normalized intrinsic noise, burst size, and frequency of inhibitor-treated cells from that of control cells, respectively. Error bars indicate 95% confidence interval. (G) Effect of Suz12 K/O on normalized intrinsic noise. Suz12 K/O cell lines derived from Dnmt3l, Dnmt3b, Peg3, and Ctcf KI cell lines were established. Upper panel represents the result of Western blotting. In the lower part of the panel, the Δnormalized intrinsic noise, Δburst size, and Δburst frequency compared with the control (cont1) are shown. Error bars indicate 95% confidence interval. Asterisks indicate significance at P < 0.05.
