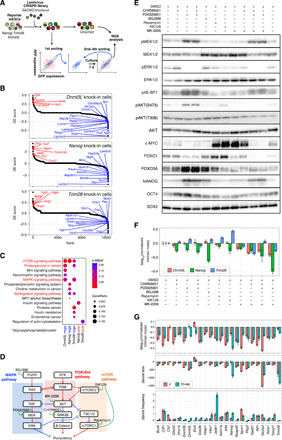
Fig. 4. CRISPR library screening of genes involved in intrinsic noise regulation.

(A) Schematic diagram of CRISPR lentivirus library screening. Screening was performed independently for each of the three (Nanog, Trim28, and Dnmt3l) KI cell lines. (B) Ranked differentially expressed (DE) score plots obtained by performing CRISPR screening on three cell lines. The higher the DE score, the more the effect of enhancing intrinsic noise. (C) KEGG pathway enrichment analysis. KEGG pathway enrichment analysis was performed using clusterProfiler (see Materials and Methods), with the upper or lower 100 genes of DE score obtained from the CRISPR screening (referred as posi and nega, respectively). The pathways shown in red indicate hits in multiple groups of genes. Genes corresponding to these pathways are labeled in (B). (D) Simplified diagram of MAPK, Akt, and mTOR signaling pathways. These pathways are included in the pathways highlighted in red in (C) and cross-talk with each other. (E) Western blot of cells treated with signal pathway inhibitors. (F) Δnormalized intrinsic noise of cells treated with signal pathway inhibitors against control [dimethyl sulfoxide (DMSO)–treated] cells. Error bars indicate 95% confidence interval. (G) Twenty-four KI cell lines were conditioned to 2i or PD-MK conditions and subjected to flow cytometry analysis. Δnormalized intrinsic noise, Δburst size, and Δburst frequency against control (DMSO-treated) cells are shown. Error bars indicate 95% confidence interval.
