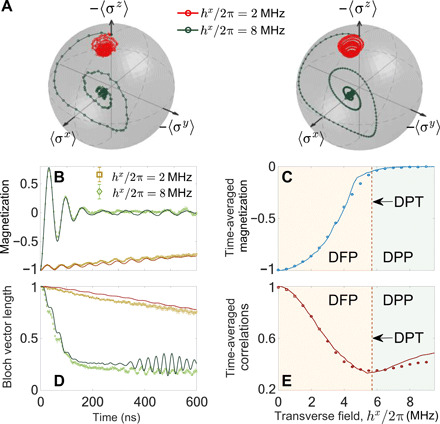
Fig. 2. Magnetization and spin correlation.

(A) Experimental (left) and numerical (right) data of the time evolution of the average spin magnetization shown in the Bloch sphere for different strengths of the transverse fields. (B) Time evolution of the magnetization 〈σz(t)〉. (C) Nonequilibrium order parameter , as a function of hx/2π. (D) Dynamics of the Bloch vector length . (E) Averaged spin correlation versus hx/2π. The regions with light red and light blue in (C) and (E) show the DFP and DPP, respectively, separated by a theoretically predicted critical point . The solid curves in (B) to (E) are the numerical results using the Hamiltonian of our experimental system without considering decoherence.
