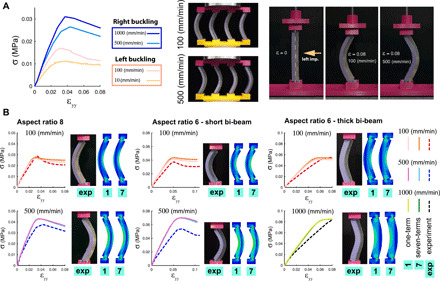
Fig. 4. Strain rate–based programming of the buckling direction in realistic bi-beams.

(A) Stress-strain curves of actual bi-beams compressed at different loading rates. The warm colors refer to left buckling, while the cold colors stand for right buckling. The bi-beams were predisposed to left buckling. Switching in the direction of buckling (from left to right) happens by increasing the loading speed (from 100 to 500 mm/min). (B) Comparison between the buckling direction and the stress-strain curves predicted by our computational models and the experimental observations of the same quantities for two different aspect ratios of the bi-beams (i.e., 6 and 8) and for bi-beams with a variation in the thickness of their hyperelastic beam. The lengths of the beams with aspect ratios of 8 and 6 (short bi-beam) were, respectively, 120 and 90 mm (beam thickness = 21 mm for all types of beams). The length of the thick bi-beams was 120 mm, while the width of the hyperelastic beam was 12.5 mm, and the width of the visco-hyperelastic beam was 7.5 mm. Two types of computational models were used with either single-term or seven-term Prony series representing the viscous behavior. Photo credit: Shahram Janbaz, Delft University of Technology.
