
Fig. 2. ADAR1 and ADAR2 interact with DAP3 through different domains.
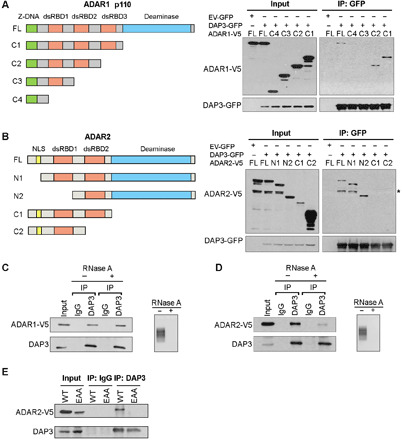
(A) Schematic diagrams of full-length (FL), C1, C2, C3, and C4 deletion mutants of ADAR1 p110 isoform (left). Co-IP analysis of protein lysates from EC109 cells transfected with V5-tagged deletion mutants and DAP3-GFP or EV-GFP, using GFP-trap system, followed by WB analysis of GFP-pulldown products using GFP and V5 antibodies (right). (B) Schematic diagrams of FL, N1, N2, C1, and C2 mutants of ADAR2 (left). Co-IP and WB analyses were conducted as described in (A). *, nonspecific band; NLS, nuclear localization signal. (C and D) Co-IP analysis was conducted in EC109 cells transfected with (C) ADAR1-V5 and (D) ADAR2-V5. Before IP assays, protein lysates were treated with (+) or without (−) RNase A, followed by WB analysis of DAP3-pulldown products using V5 and DAP3 antibodies. Agarose gel demonstrating the successful digestion of total RNA. (E) Co-IP analysis was conducted in EC109 cells transfected with the indicated construct, followed by WB analysis using V5 and DAP3 antibodies. (A to E) One percent of the total cell lysate was loaded as an input control.