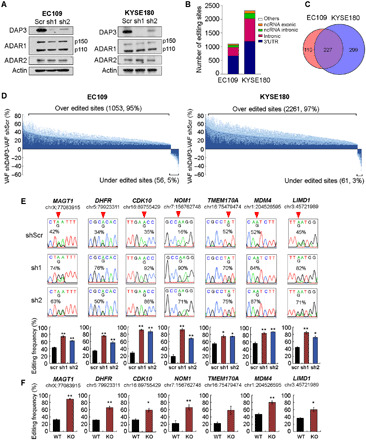
Fig. 3. DAP3 functions as a potent editing repressor in ESCC cells.

(A) WB analysis of the indicated proteins in stable DAP3-knockdown EC109 and KYSE180 cells. β-Actin (Actin) was used as a loading control. (B) Distribution of DAP3-affected editing sites over annotated genomic regions in EC109 and KYSE180 cells. (C) Venn diagram showing genes containing DAP3-affected sites in EC109 and KYSE180 cells. (D) Transcriptome-wide RNA editing analysis uncovers DAP3-knockdown–mediated changes in A-to-I editome of EC109 and KYSE180 cells. Changes in editing level are calculated by subtracting VAF (variant allele frequency) of shDAP3 with VAF of shscr (VAFshDAP3 − VAFshscr). Data are shown as the average editing change (mean; deep blue) induced by DAP3 sh1 and sh2 with the SE (SEM; light blue). (E) Sanger sequencing chromatograms illustrate editing of randomly selected sites (top). Quantification of editing frequency of each site is shown in the bottom. Data are presented as mean ± SEM. of technical triplicates. (F) Quantification of editing frequency of DAP3-affected sites in WT and DAP3-KO EC109 cells. Data are presented as mean ± SEM. of three individual clones generated by the CRISPR-Cas9 method. (E and F) Percentage represents the editing frequency calculated by taking the peak area of “G” peak over the sum of “A” and “G” peaks. Arrow indicates position of editing. Statistical analysis is conducted using unpaired, two-tailed Student’s t test (*P < 0.05; **P < 0.01).
