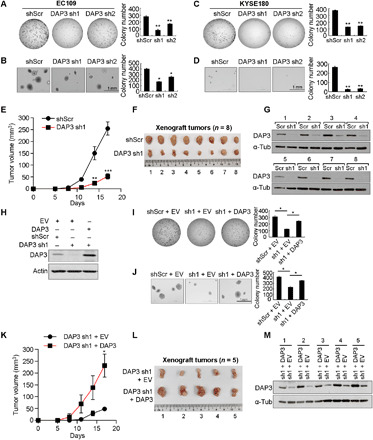
Fig. 6. DAP3 functions as an oncogene.

(A and B) Quantification of foci formation (A) or soft agar colony formation (B) in the indicated stable EC109 cells. (C and D) Quantification of foci formation (C) or soft agar colony formation (D) in the indicated stable KYSE180 cells. (E) Growth curve of tumors derived from the indicated stable cells in mice. (F) Tumors derived from the indicated stable cell lines at end point (n = 8 mice per group). (G) WB analysis of DAP3 protein in xenograft tumors at end point. (H) WB analysis of DAP3 expression in stable DAP3-depleted EC109 cells without (DAP3 sh1 + EV) or with the restored DAP3 expression (DAP3 sh1 + DAP3). (I and J) Quantification of foci formation (I) or soft agar colony formation (J) in the indicated stable cells. (K) Growth curve of tumors derived from the indicated stable cells in mice. (L) Tumors derived from the indicated stable cell lines at end point (n = 5 mice per group). (M) WB analysis of DAP3 protein in xenograft tumors at end point (A to D, I, and J) Data are presented as the mean ± SD of duplicate or triplicate wells from a representative experiment. (E and K) Data are presented as the mean ± SEM. Statistical significance is determined by unpaired, two-tailed Student’s t test (*P < 0.05; **P < 0.01; ***P < 0.001).
