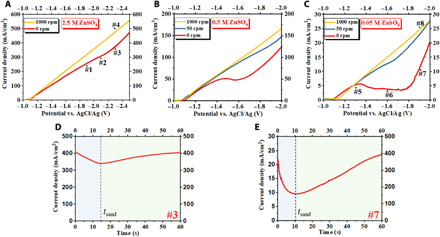
Fig. 2. Electrochemical measurements of Zn electrodeposition.

Current-voltage (i-V) curves of Zn electrodeposition on a glassy carbon electrode at a scan rate of 5 mV/s in (A) 2.5 M, (B) 0.5 M, and (C) 0.05 M ZnSO4 (aq) electrolytes. Time-dependent current measured in constant-voltage, chronoamperometric Zn electrodeposition in the overlimiting transport regime: (D) 2.5 M and (E) 0.05 M ZnSO4 (aq) electrolyte. For the results in (D), the potential was held at −2.3 V, and in (E) at −1.9 V versus (AgCl/Ag).
