
Fig. 3. SEM images showing morphological evolution of Zn electrodeposits in a concentrated, 2.5 M ZnSO4 (aq) electrolyte at different potentials.
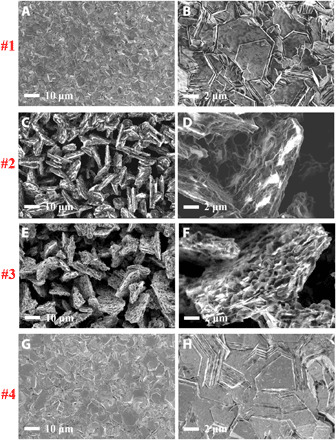
Values of (A and B) −1.9 V, (C and D) −2.1 V, and (E and F) −2.3 V without rotation and (G and H) −2.3 V with 1000 rpm rotation. Deposition time, 60 s.