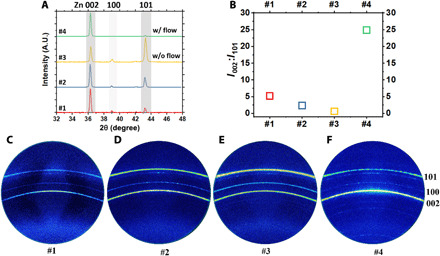
Fig. 5. X-ray analysis of the crystallographic evolution of Zn during electrodeposition in a concentrated, 2.5 M ZnSO4 (aq) electrolyte with and without normal flow.

(A) XRD line scan patterns for the Zn electrodeposits. A.U., arbitrary units. (B) Peak intensity ratio of the Zn 002:101 deduced from the line scans in (A). 2D XRD patterns of Zn electrodeposited at (C) −1.9 V, (D) −2.1 V, and (E) −2.3 V without rotation and (F) −2.3 V with 1000 rpm rotation.
