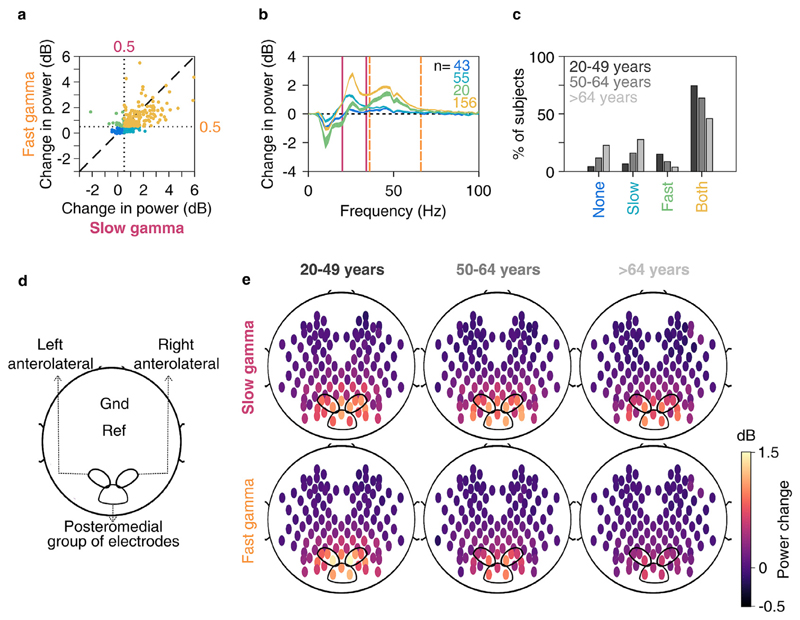
Fig. 3. Slow and fast gamma in younger and elderly subjects.
a) Scatter plot showing change in slow (abscissa) and fast (ordinate) gamma power. Dotted lines represent 0.5 dB threshold. Points represent subjects with no gamma (dark blue), only slow gamma (light blue), only fast gamma (green) and both gamma rhythms (yellow) with change in power above 0.5 dB threshold. b) Change in PSDs vs frequency averaged across subjects (numbers denoted by n) as categorized in 3a. Thickness of traces indicate SEM. Solid pink and dashed lines represent slow and fast gamma ranges respectively. c) Bar plot showing percentage of subjects in three age-groups (marked by respective colors) categorized as in 3a. d) Schematic showing placements of left and right anterolateral and posteromedial group of bipolar electrodes used for analysis on the scalp, as well as ground (Gnd) and online reference (Ref) electrodes. e) Average scalp maps of 112 bipolar electrodes (disks) for three age-groups for slow (top row) and fast (bottom row) gamma. Color of disks represents change in respective gamma power. Electrode groups represented as in 3d.

