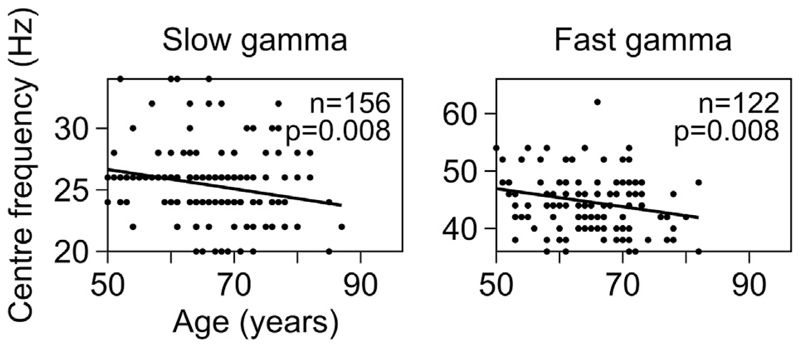
Fig. 5. Center frequency of slow and fast gamma vs age for elderly subjects for anterolateral group of electrodes.
Scatter plots showing center frequency vs age for slow and fast gamma, for anterolateral electrodes, for those subjects who have change in power in respective gamma range above 0.5 dB (numbers indicated on the plots). Solid lines indicate regression fits for center frequency vs age. p-values for these fits are as indicated.

