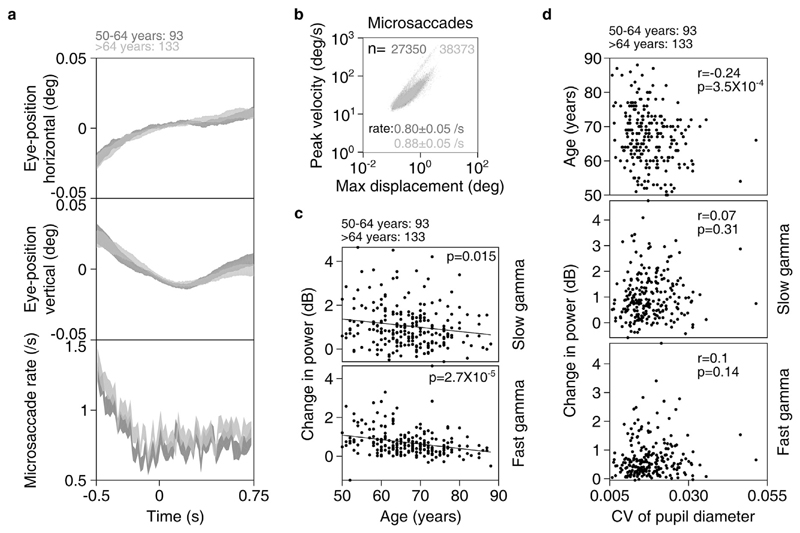
Fig. 7. Eye position, microsaccades and pupillary reactivity across age for elderly subjects.
a) Eye-position in horizontal (top row) and vertical (middle row) directions; and histogram showing microsaccade rate (bottom row) vs time (-0.5–0.75 s of stimulus onset) for elderly subjects (n = 226). Number of subjects in each age-group is indicated on top. Thickness indicates SEM. b) Main sequence showing peak velocity and maximum displacement of all microsaccades (number indicated by n) extracted for both elderly age-groups. Average microsaccade rate (mean ± SEM) across all subjects for each elderly age-group is also indicated. c) Scatter plot showing change in power vs age for slow (top row) and fast (bottom row) gamma for all elderly subjects with analyzable data after removal of trials containing microsaccades. Solid lines indicate regression fits. Numbers of subjects with analyzable data in each age-group is indicated on top. d) Scatter plots for coefficient of variation (CV) of pupil diameter vs age (top row), change in slow (middle row) and fast (bottom row) gamma power. Pearson correlation coefficients (r) and p-values are also indicated.

