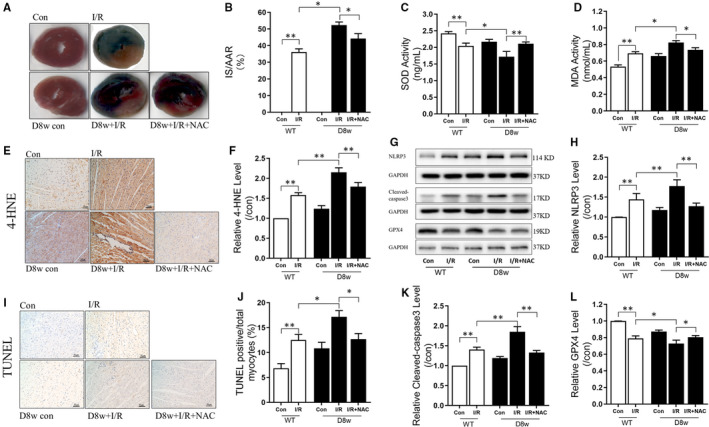
FIGURE 1.

Increase in myocardial oxidative stress and programmed cell death after myocardial I/R injury in diabetic hearts. A, The infarct size (IS) in the Con and diabetic rats determined by TTC and Evans blue staining; B, Post‐ischaemia IS expressed as percentage of IS to the area at risk (AAR); C, SOD activity during myocardial I/RI in Con and diabetic rats; D, MDA release during myocardial I/RI in Con and diabetic rats; E, 4‐HNE staining; F, Changes in relative 4‐HNE levels in Con and diabetic rats; G, The WB bands showing the protein expression of NLRP3, Cleaved caspase‐3, GPX4 and GAPDH; H, The change in protein expression levels of NLRP3 during myocardial I/RI in Con and diabetic rats; I, TUNEL staining; J, TUNEL positive/total myocytes; K, the change in protein expression levels of cleaved caspase‐3 in Con and diabetic rats; L, The change in protein expression levels of GPX4 during myocardial I/RI in Con and diabetic rats. Myocardial ischaemia reperfusion (I/R) was achieved by 30 min ischaemia and 120 min reperfusion. Data are expressed as mean ± SEM, n = 6 per group. *P < 0.05, **P < 0.01
