Figure 4.

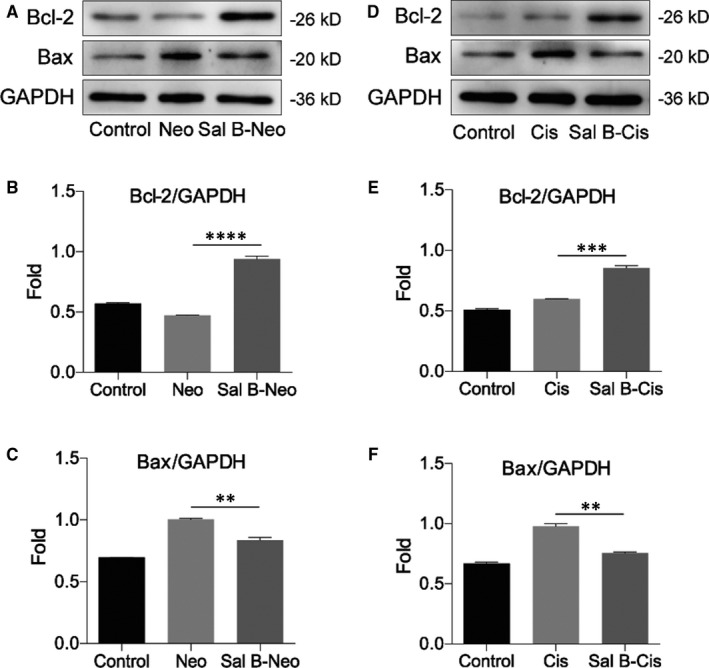
Effect of Sal B on the expressions of the Bcl‐2 family proteins. (A) Representative Western blot image showed the expression of Bcl‐2 and Bax in the control, Neo and Sal B‐Neo groups, and the columns (B and C) showed the quantification of the fold changes of expression. (D) Representative Western blot image showed the expression of Bcl‐2 and Bax in the control, Cis and Sal B‐Cis groups, and the columns (E and F) showed the quantification of the fold changes of expression. The data expression for protein was normalized by GAPDH. Data were presented as the mean ± SEM. **P < 0.01, ***P < 0.001, ****P < 0.0001
