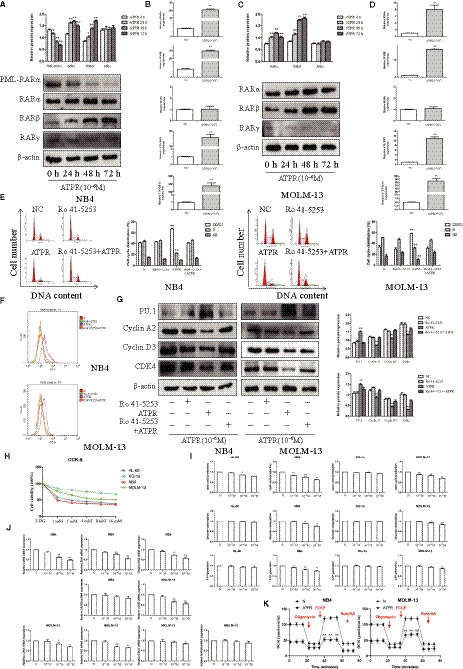
Figure 2.

ATPR shows antileukaemic effects with RARα dependent. (A) The NB4 cells were treated with ATPR (10−6M) for different durations (24h–72 h). The protein expression of PML‐RARα, RARα, RARβ and RARγ was assessed by Western blotting (Mean ± SD, n = 3). (B) Values are presented as the mean ± SD (n = 3) of three in Quantitative real‐time PCR analysis of mRNA expression of RARα, RARβ, RARγ, CRABP2 and CYP26A1 treated with ATPR (10−6M) for 48h in NB4 cells‐dependent experiments. (C) The MOLM‐13 cells were treated with ATPR (10−6M) for different durations (24h–72h). The protein expression of RARα, RARβ and RARγ was assessed by Western blotting (Mean ± SD, n = 3). (D) Values are presented as the mean ± SD of three in Quantitative real‐time PCR analysis of mRNA expression of RARα, RARβ, RARγ, CRABP2 and CYP26A1 treated with ATPR (10−6M) for 48h in MOLM‐13 cells‐dependent experiments. (E) The cell cycle distribution was analysed by flow cytometry (Mean ± SD, n = 3). (F) CD11b expression was analysed by flow cytometer. (G) The protein expression of PU.1, Cyclin A2, CDK4 and Cyclin D3 was assessed by Western blotting (Mean ± SD, n = 3). (H) AML cells were exposed to various concentrations (0, 2, 4, 8 or 10mM) of 2‐DG for 72 h, followed by the determination of cell viability using the CCK8 assay. (I) AML cells were exposed to various concentrations (0, 10−7, 10−6, or 10−5 M) of ATPR for 72 h, followed by the determination of the glycolysis rate using the glucose, lactic acid and ATP detection kit (Mean ± SD, n = 3). (J) Values are presented as the mean ± SD of three in Quantitative real‐time PCR analysis of mRNA expression of LDHB, LDHA, HK2, ENO1 and GAPDH treated with ATPR (10−6M) for 48h in MOLM‐13 and NB4 cells‐dependent experiments (K) The OCR was determined in MOLM‐13 and NB4 cells by Seahorse XF. *P < 0.05, **P < 0.01 versus control group
