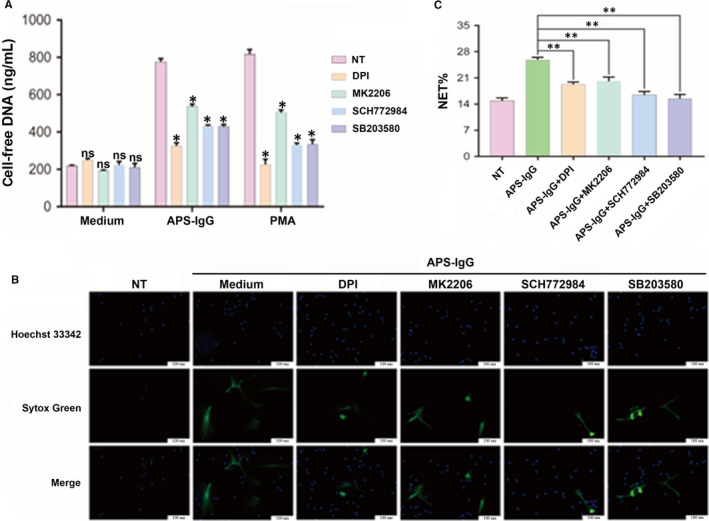
FIGURE 6.

Effects of NADPH oxidase, AKT, ERK1/2 and p38 MAPK inhibitors on NET release. Freshly isolated neutrophils were separately pre‐treated with DPI (10 μmol/L), MK2206 (10 μmol/L), SCH772984 (10 μmol/L) or SB203580 (20 μmol/L) for 0.5 h, followed by incubation for another 3 h with APS‐IgG (15 µg/mL), PMA (50 nmol/L) or complete medium (no treatment; NT). A, Cell‐free DNA levels in the supernatant. B, Representative live‐cell images of NET release. SYTOX Green staining represents extracellular DNA; Hoechst 33 342 staining represents intracellular DNA. Scale bars = 100 microns. C, NET release was scored as presented in panel B. Data are presented as the mean ± SEM of at least three independent experiments. *P < 0.05, **P < 0.01; ns, not significant. APS, antiphospholipid syndrome; DPI, diphenylene iodonium; NET, Neutrophil extracellular trap
