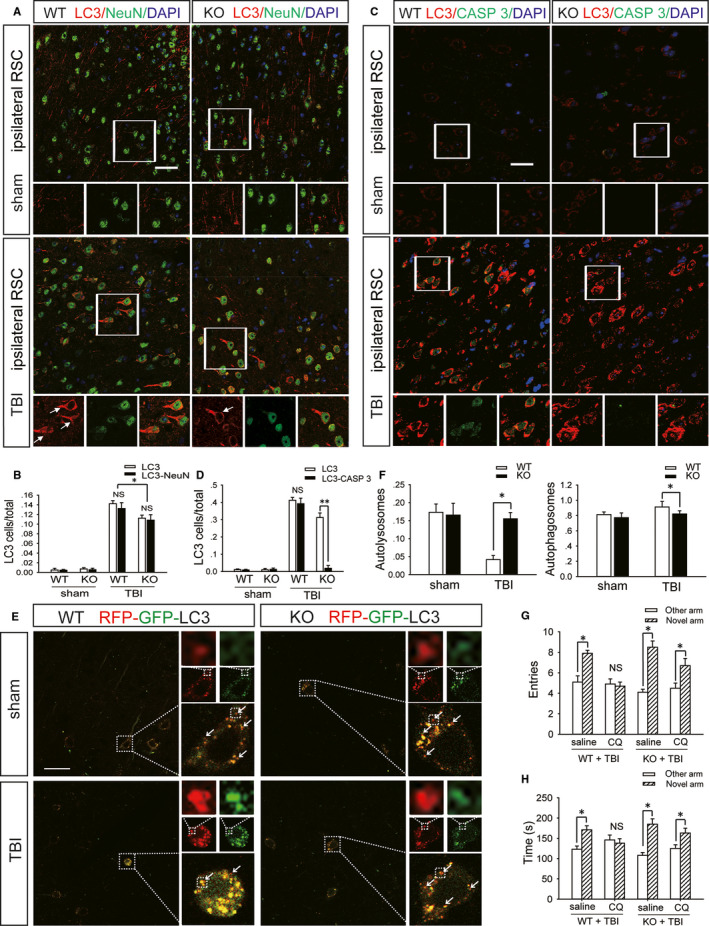
FIGURE 4.

A2AR KO can reduce the impairment of spatial recognition memory by improving autophagic flux in retrosplenial cortical neurons after TBI. A, Images of sections of the ipsilateral retrosplenial cortex of WT and KO mice in the sham and moderate TBI groups. The sections were stained with antibodies against LC3 and NeuN; red fluorescence represents LC3 and green fluorescence represents NeuN. Scale bar = 40 μm. B, Quantification of the number of cells that were positive for LC3 only and for both LC3 and NeuN in ipsilateral retrosplenial cortex sections shown in (A). Data are presented as the means ± SDs, n = 3, KO + TBI group vs WT + TBI group, **P < 0.01. More than 1000 cells were quantified in each section from each mouse in each experiment. C, Images of sections of the ipsilateral retrosplenial cortex of WT and KO mice in the sham and moderate TBI groups. Sections were stained with antibodies against LC3 and caspase‐3 (CASP 3); red fluorescence represents LC3 and green fluorescence represents CASP 3. Scale bar = 40 μm. D, Quantification of the number of cells that were positive for LC3 only and for both LC3 and CASP 3 in the ipsilateral retrosplenial cortex sections shown in (C). Data are presented as the means ± SD, n = 3, KO + TBI group vs WT + TBI group, **P < 0.01. More than 1000 cells were quantified in each section from each mouse in each experiment. E, Images of ipsilateral retrosplenial cortex sections obtained from WT and KO mice injected with AAV‐RFP‐GFP‐LC3 in the sham and moderate TBI groups. Arrows indicate the presence of red puncta. Scale bar = 40 μm. F, Quantification of the percentage of autolysosomes (red puncta/total puncta) and autophagosomes (yellow (red + green) puncta/total puncta) in the images shown in (E). Data are presented as the means ± SDs, n = 3, KO + TBI group vs WT + TBI group, *P < 0.05. More than 100 cells were quantified in each section from each mouse in each experiment. G, The number of entries into the novel arm and other arm by WT and KO mice that were subjected to mild TBI and administered CQ or saline; CQ: chloroquine. Data are presented as the means ± SDs, n = 9, novel arm vs other arm, *P < 0.05. H, Exploration time in the novel arm and other arm by WT and KO mice that were subjected to mild TBI and administered CQ or saline. Data are presented as the means ± SDs, n = 9, novel arm vs other arm, *P < 0.05. AAV, Adeno‐associated virus; GFP, green fluorescent protein; KO, knockout; RFP, red fluorescent protein; TBI, traumatic brain injury; WT, wild‐type
