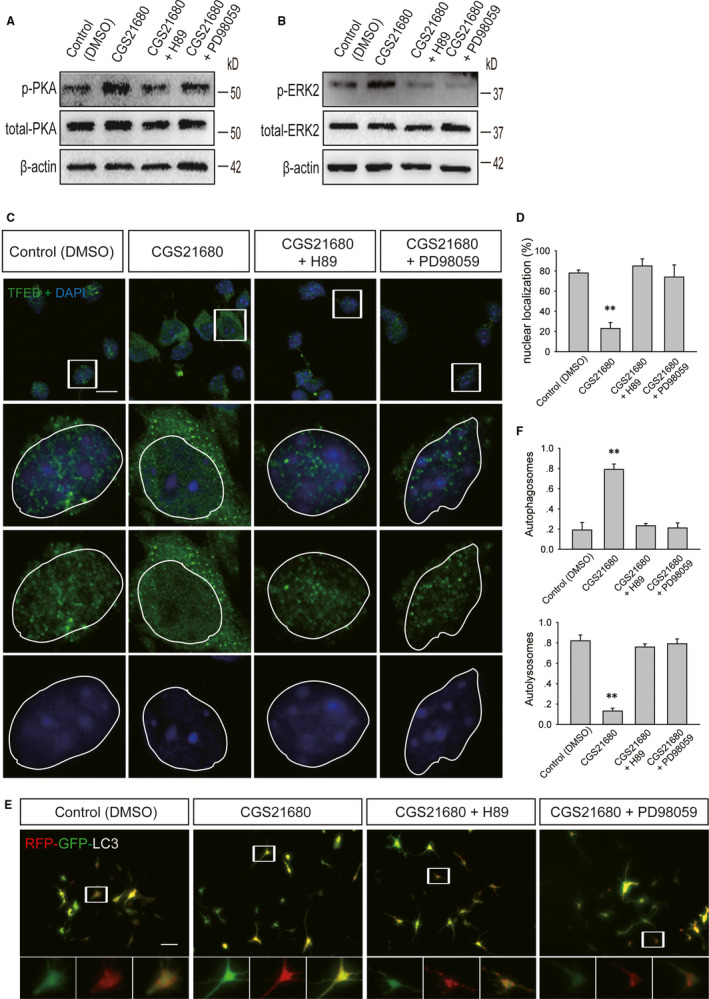
FIGURE 6.

PKA and ERK2 are involved in the regulation of TFEB and autophagic flux after A2AR activation. A, Western blot analysis of the levels of phosphorylated PKA and total PKA in primary cultured cortical neurons from the control (DMSO), CGS21680, CGS21680 + H89 and CGS21680 + PD98059 groups; DMSO: dimethyl sulfoxide, CGS21680: A2AR agonist, H89: PKA inhibitor and PD98059: ERK inhibitor. B, Western blot analysis of the levels of phosphorylated PKA and total PKA in primary cultured cortical neurons from the control, CGS21680, CGS21680 + H89 and CGS21680 + PD98059 groups. C, Images of primary cultured cortical neurons from the control, CGS21680, CGS21680 + H89 and CGS21680 + PD98059 groups. Neurons were stained using an anti‐TFEB antibody; green fluorescence represents TFEB. Scale bar = 10 μm. D, Quantification of the number of cells with TFEB localized to the nucleus shown in (C). Data are presented as the means ± SDs, n = 3, **P < 0.01 compared to the control group. More than 100 cells were quantified for each group in each experiment. E, Images of primary cultured cortical neurons infected with Ad‐RFP‐GFP‐LC3 from the control, CGS21680, CGS21680 + H89 and CGS21680 + PD98059 groups. Arrows indicate the presence of red puncta. Scale bar = 20 μm. F, Quantification of the percentage of autolysosomes (red puncta/total puncta) and autophagosomes (yellow puncta/total puncta) in the images shown in (E). Data are presented as the means ± SDs, n = 3, compared to the control group, *P < 0.05. More than 100 cells were quantified for each group in each experiment. GFP, green fluorescent protein; RFP, red fluorescent protein; TFEB, transcription factor EB
