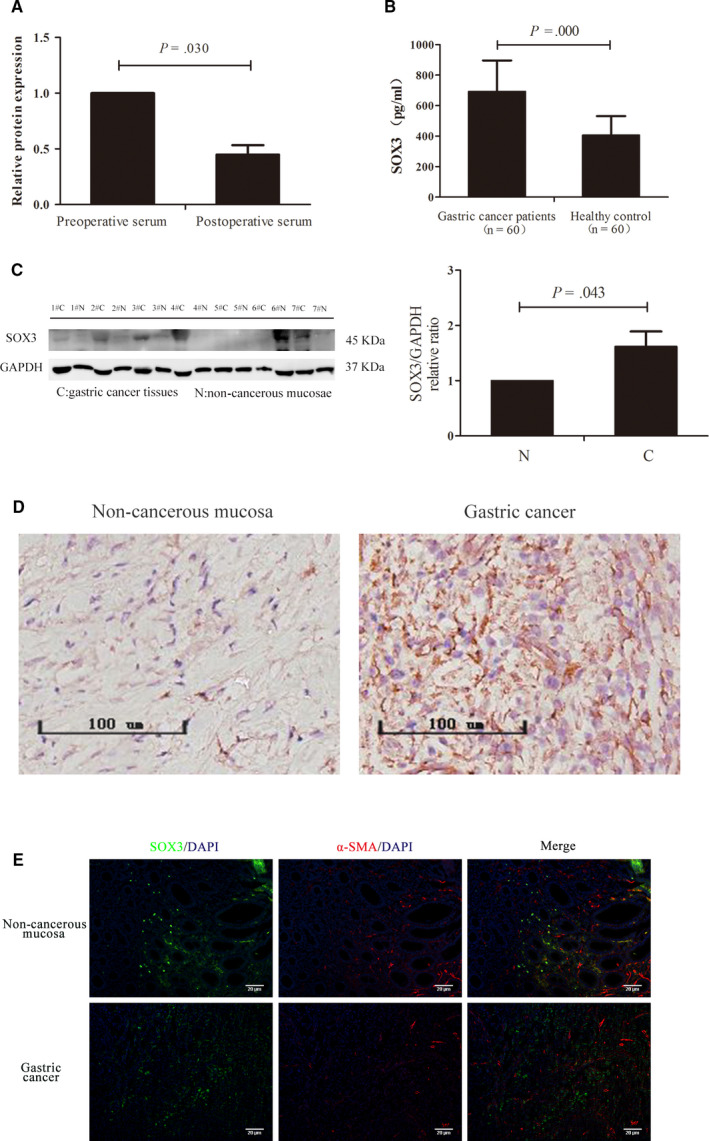
FIGURE 3.

SOX3 expression in gastric cancer tissues. A, ELISA assay with 60 gastric cancer cases showed SOX3 level in the post‐operative serums was less than in preoperative ones (P = .030). B, Serum SOX3 levels in gastric cancer patients was higher than in healthy controls (P = .000). C and D, SOX3 levels in gastric tumour tissues were higher than that in corresponding non‐cancerous mucosae. E, SOX3 was expressed in tumour parenchyma rather than tumour stroma by immunofluorescence assay (green for SOX3 and red for α‐SMA)
