Figure 2.

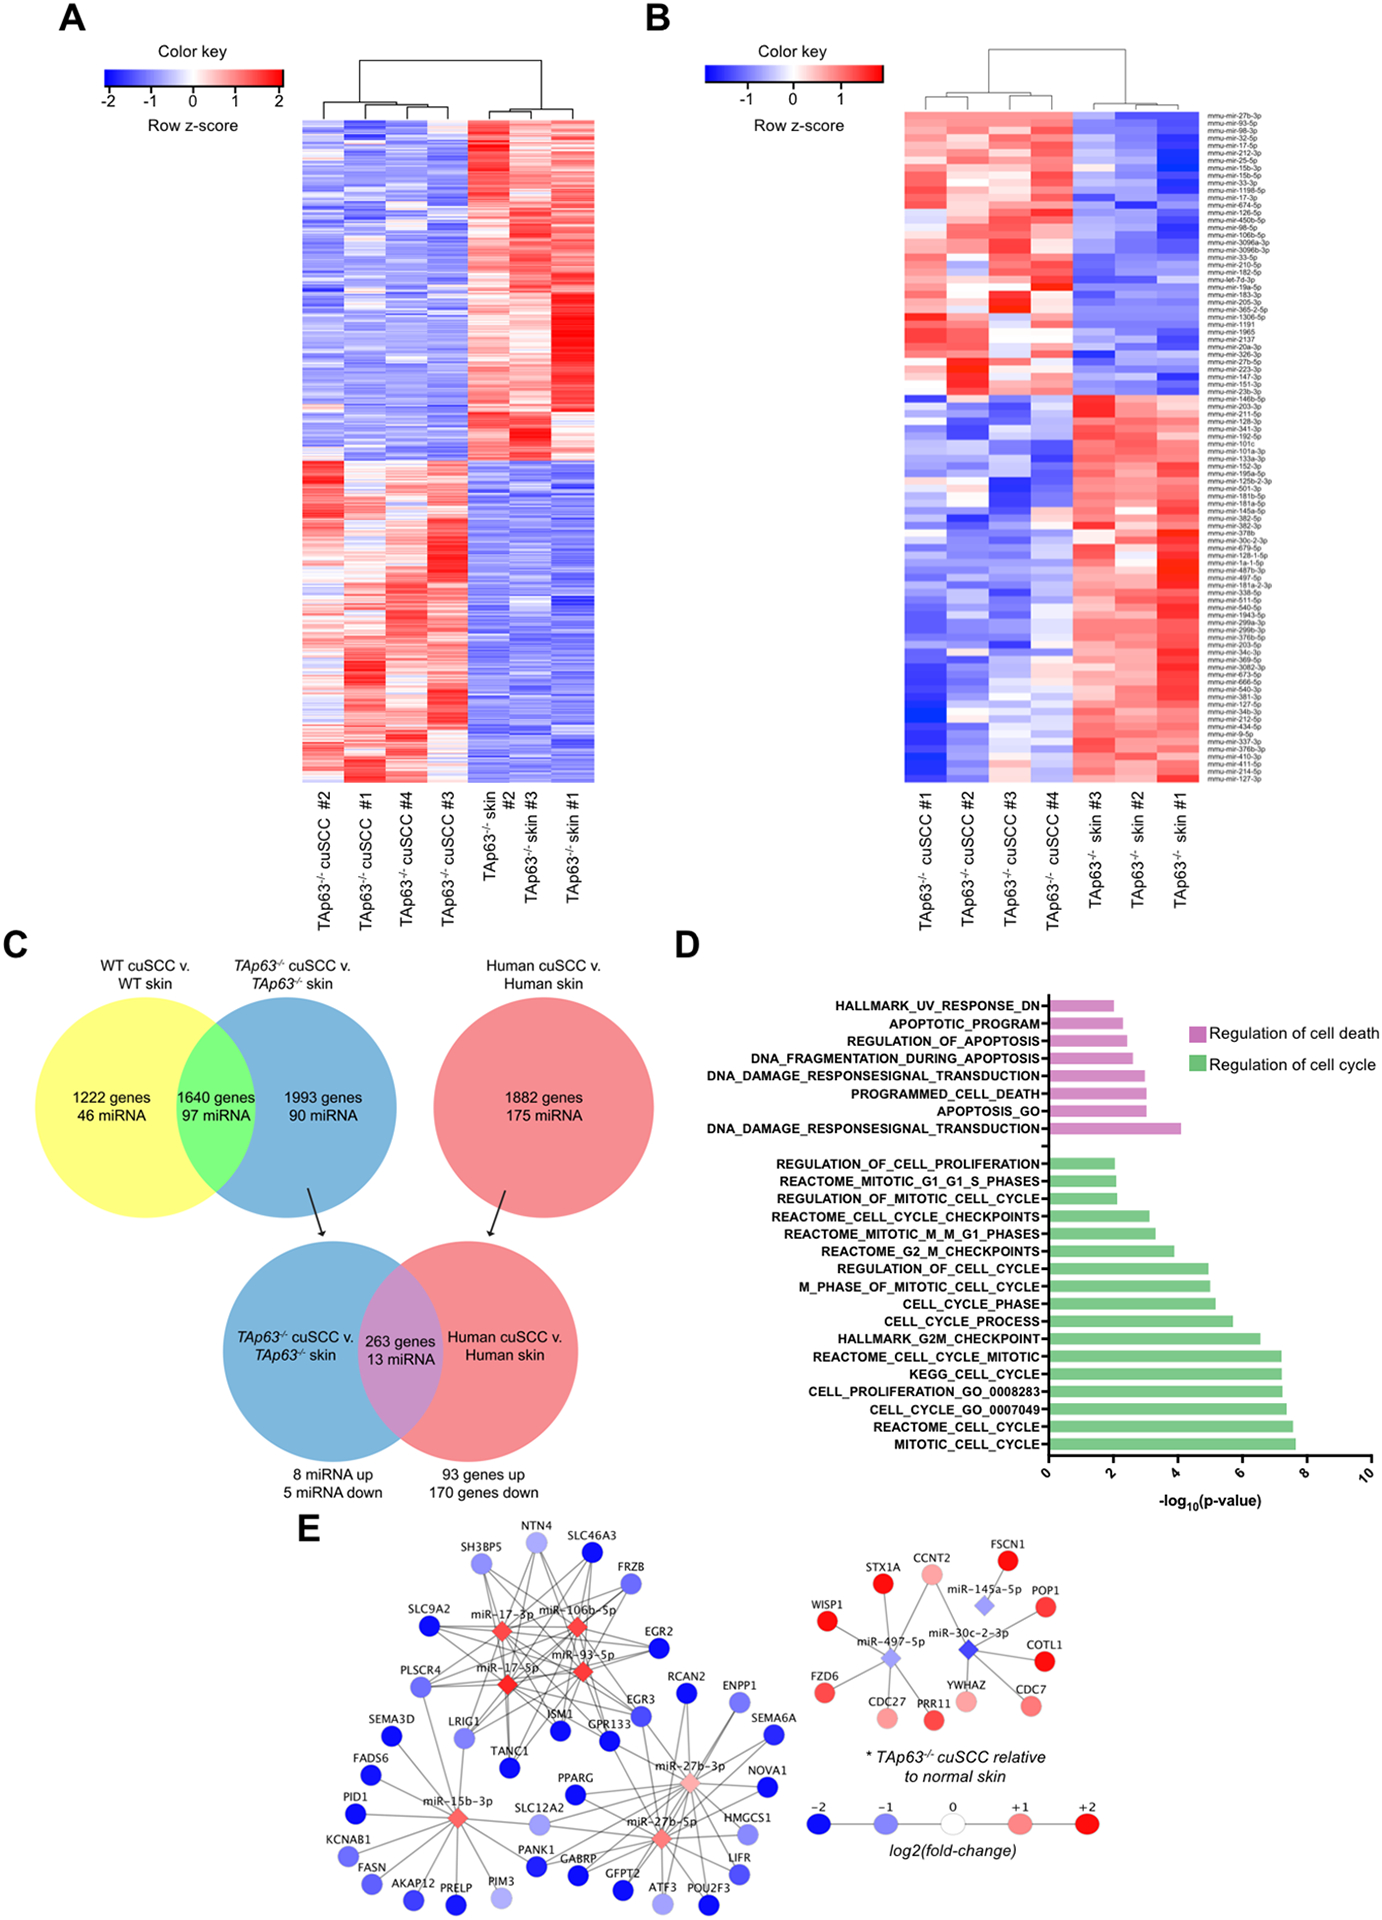
TAp63-deficient tumors exhibit deregulated mRNA and microRNA expression. A-B, Hierarchical clustering analysis based on differentially expressed mRNAs (A) and microRNAs (B) in TAp63−/− cuSCC vs. TAp63−/− skin samples. Each row represents a single mRNA or microRNA, while each column represents a sample. The Pearson correlation matrix is shown on top. The color scale illustrates the relative expression levels of mRNAs and microRNAs across each sample. Blue shades correspond to reduced expression and red shades represent increased expression levels. C, Comparison of the TAp63−/− cuSCC signature and human cuSCC identified similar differential expression of the indicated number of microRNAs and mRNAs. D, Pathway analysis of the overlapping targets (purple) identified in (C). E, Functional pair analysis identified a conserved microRNA/mRNA regulatory network in both TAp63−/− murine cuSCC and human cuSCC. Shown are microRNAs with fold change>1.5 in both comparisons.
