
Figure 3: EGFR N-Glycan Fucosylation Differs Between Indolent CAL27 Cells and Metastatic HSC-3 Cells.
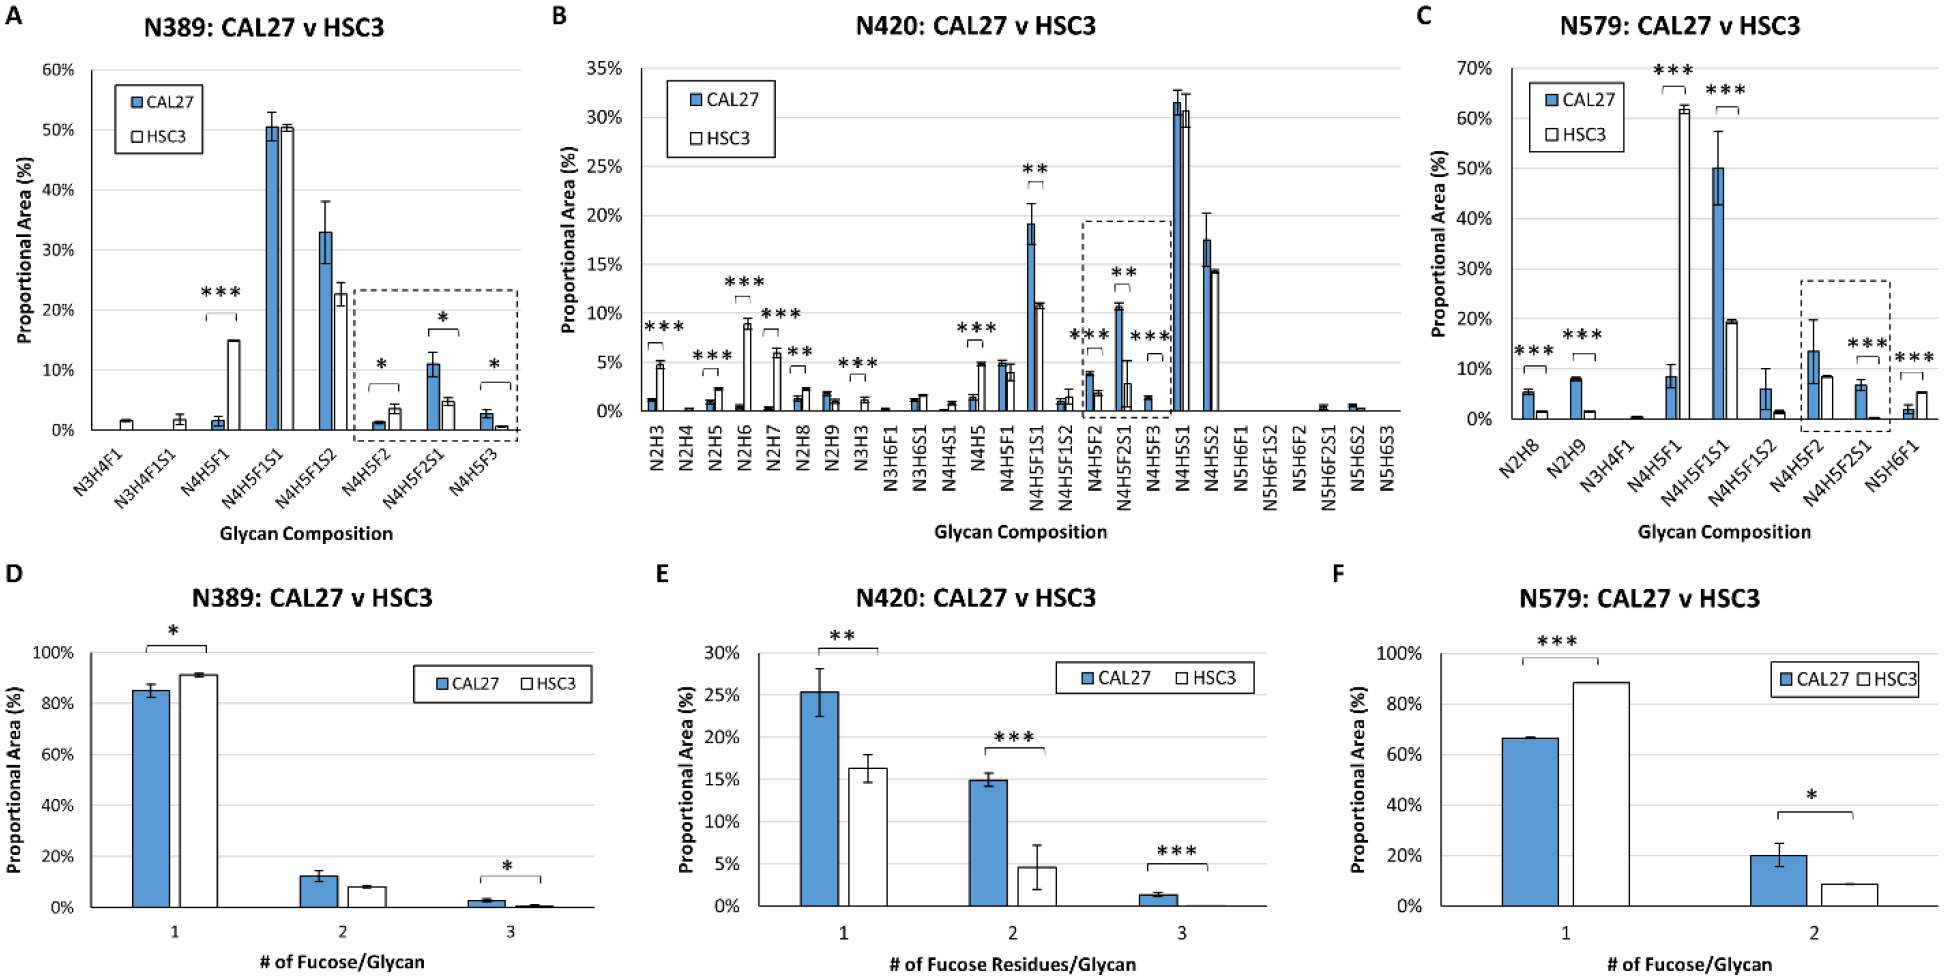
A. CAL27 (blue bars) and HSC-3 (white bars) cells display high levels of complex, singly-fucosylated glycans at site N389; proportional areas of glycan compositions are shown. B. Proportional areas of glycan compositions at site N420; glycan compositions consistent with high mannose and complex glycans were detected at this site. Singly- and multiply-fucosylated glycan compositions are more abundant in CAL27 compared to HSC-3 cells. C. Proportional areas of glycan compositions at site N579. D. Comparison of the proportional area of singly, multiply-fucosylated glycans at site N389 in CAL27 and HSC-3 cells, and for sites N420 (E) and N579 (F). For all sites, nUPLC-MS analyses were performed in triplicate (technical replicates), and the area of each glycopeptide precursor was extracted (based on m/z). Plots show the proportional area of each glycoform as a percentage of the total glycoform area for each indicated N-glycosylation site. N: N-acetylhexosamine, H: hexose (mannose or galactose), F: fucose, S: N-acetylneuraminic acid (sialic acid). Multiply-fucosylated glycan compositions are outlined (box with dashed line). * p ≤ 0.05; ** p ≤ 0.01; *** p ≤ 0.005.