
Figure 4: Inhibition of β-catenin/CBP in Metastatic HSC-3 Cells Leads to Higher Levels of EGFR N-Glycan Fucosylation.
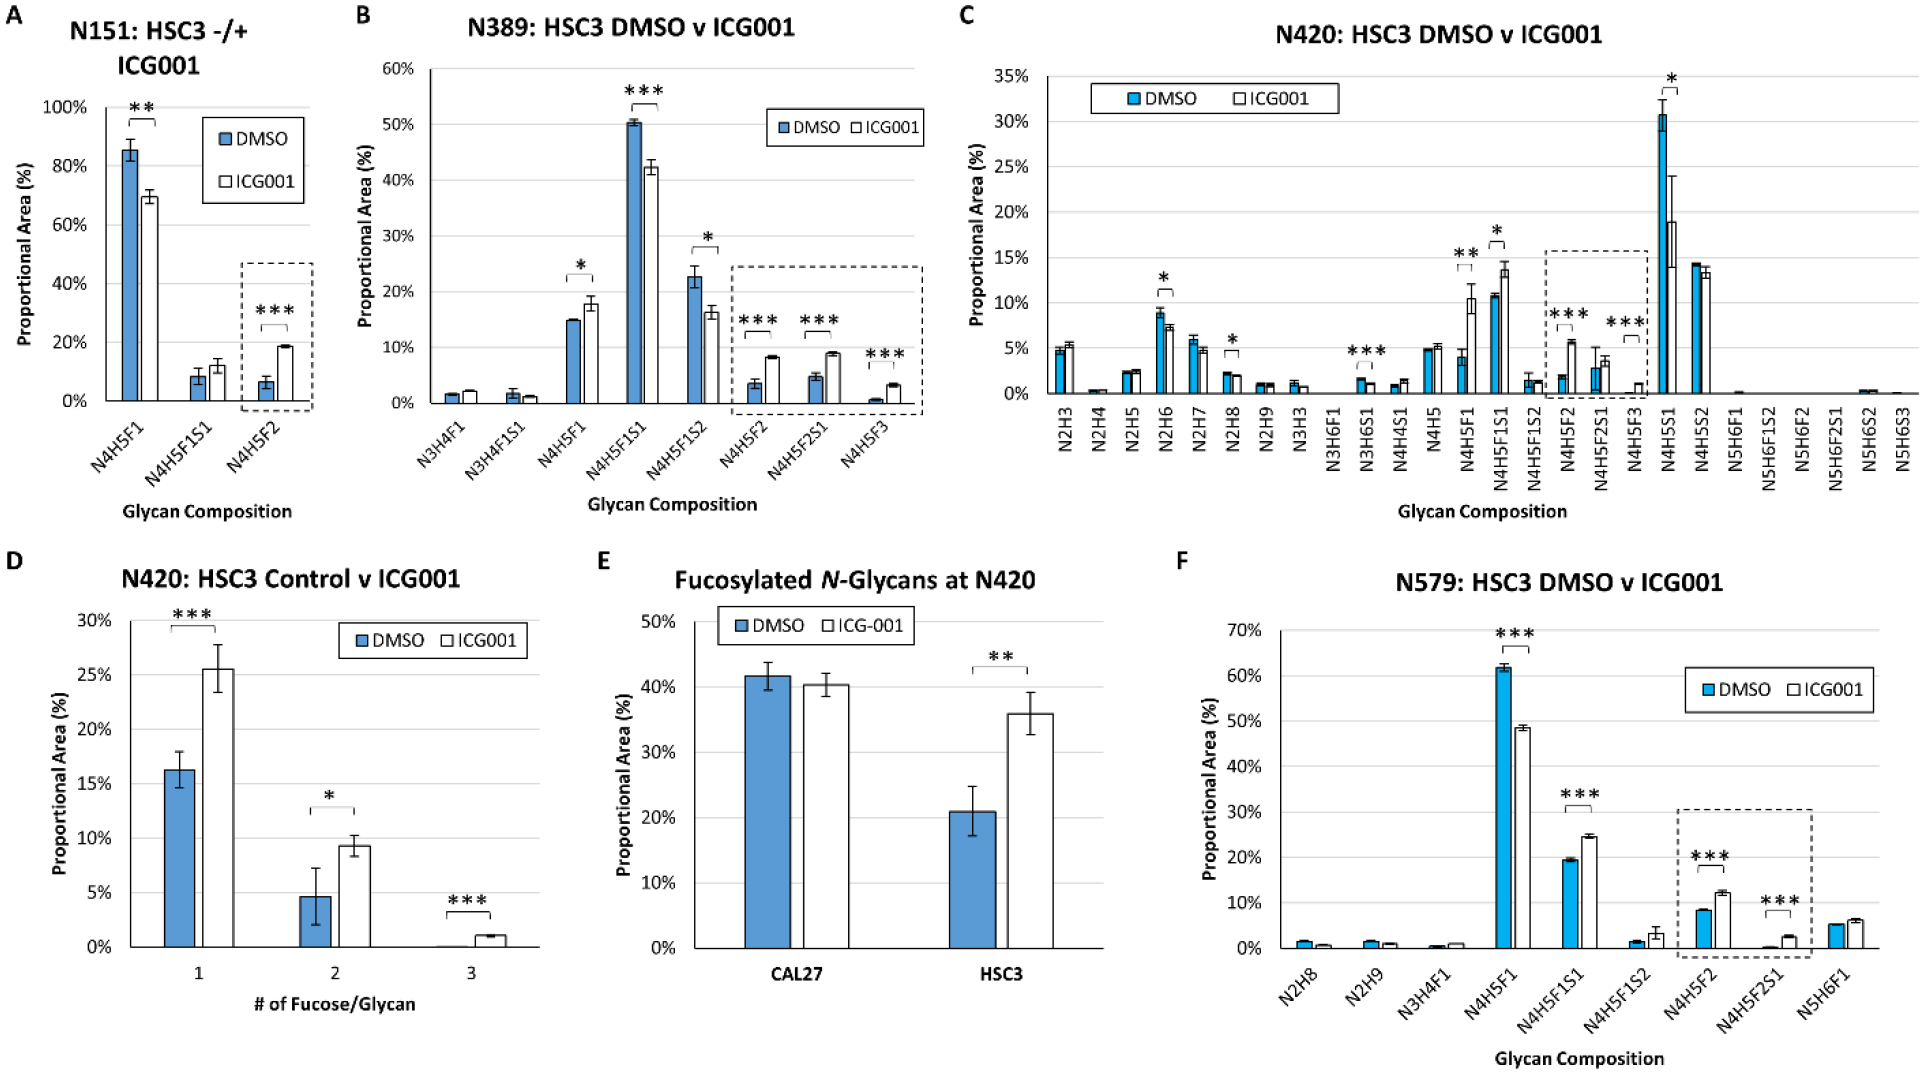
EGFR N-glycan heterogeneity at sites (A) N151, (B) N389, (C) N420, and (F) N579, in EGFR derived from HSC-3 cells treated with either a vehicle control (DMSO) or ICG-001, a small molecule inhibitor of nuclear β-catenin/CBP. Comparison of the proportional area of fucosylated glycans to total glycans at site N420 in CAL27 and HSC-3 cells in response to β-catenin/CBP inhibition (D). Proportional area of singly-, doubly-, and triply-fucosylated N-glycans at site N420 in HSC-3 cells in response to β-catenin/CBP inhibition. (E) At site N420, the proportion of fucosylated N-glycans increased in response to β-catenin/CBP inhibition in HSC-3 cells, and almost matched the levels of fucosylation observed in CAL27 cells. For all sites, nUPLC-MS analyses were performed in triplicate (technical replicates), and the area of each glycopeptide precursor was extracted (based on m/z). N: N-acetylhexosamine, H: hexose (mannose or galactose), F: fucose, S: N-acetylneuraminic acid (sialic acid). Multiply-fucosylated glycan compositions are outlined (box with dashed line). * p ≤ 0.05; ** p ≤ 0.01; *** p ≤ 0.005.