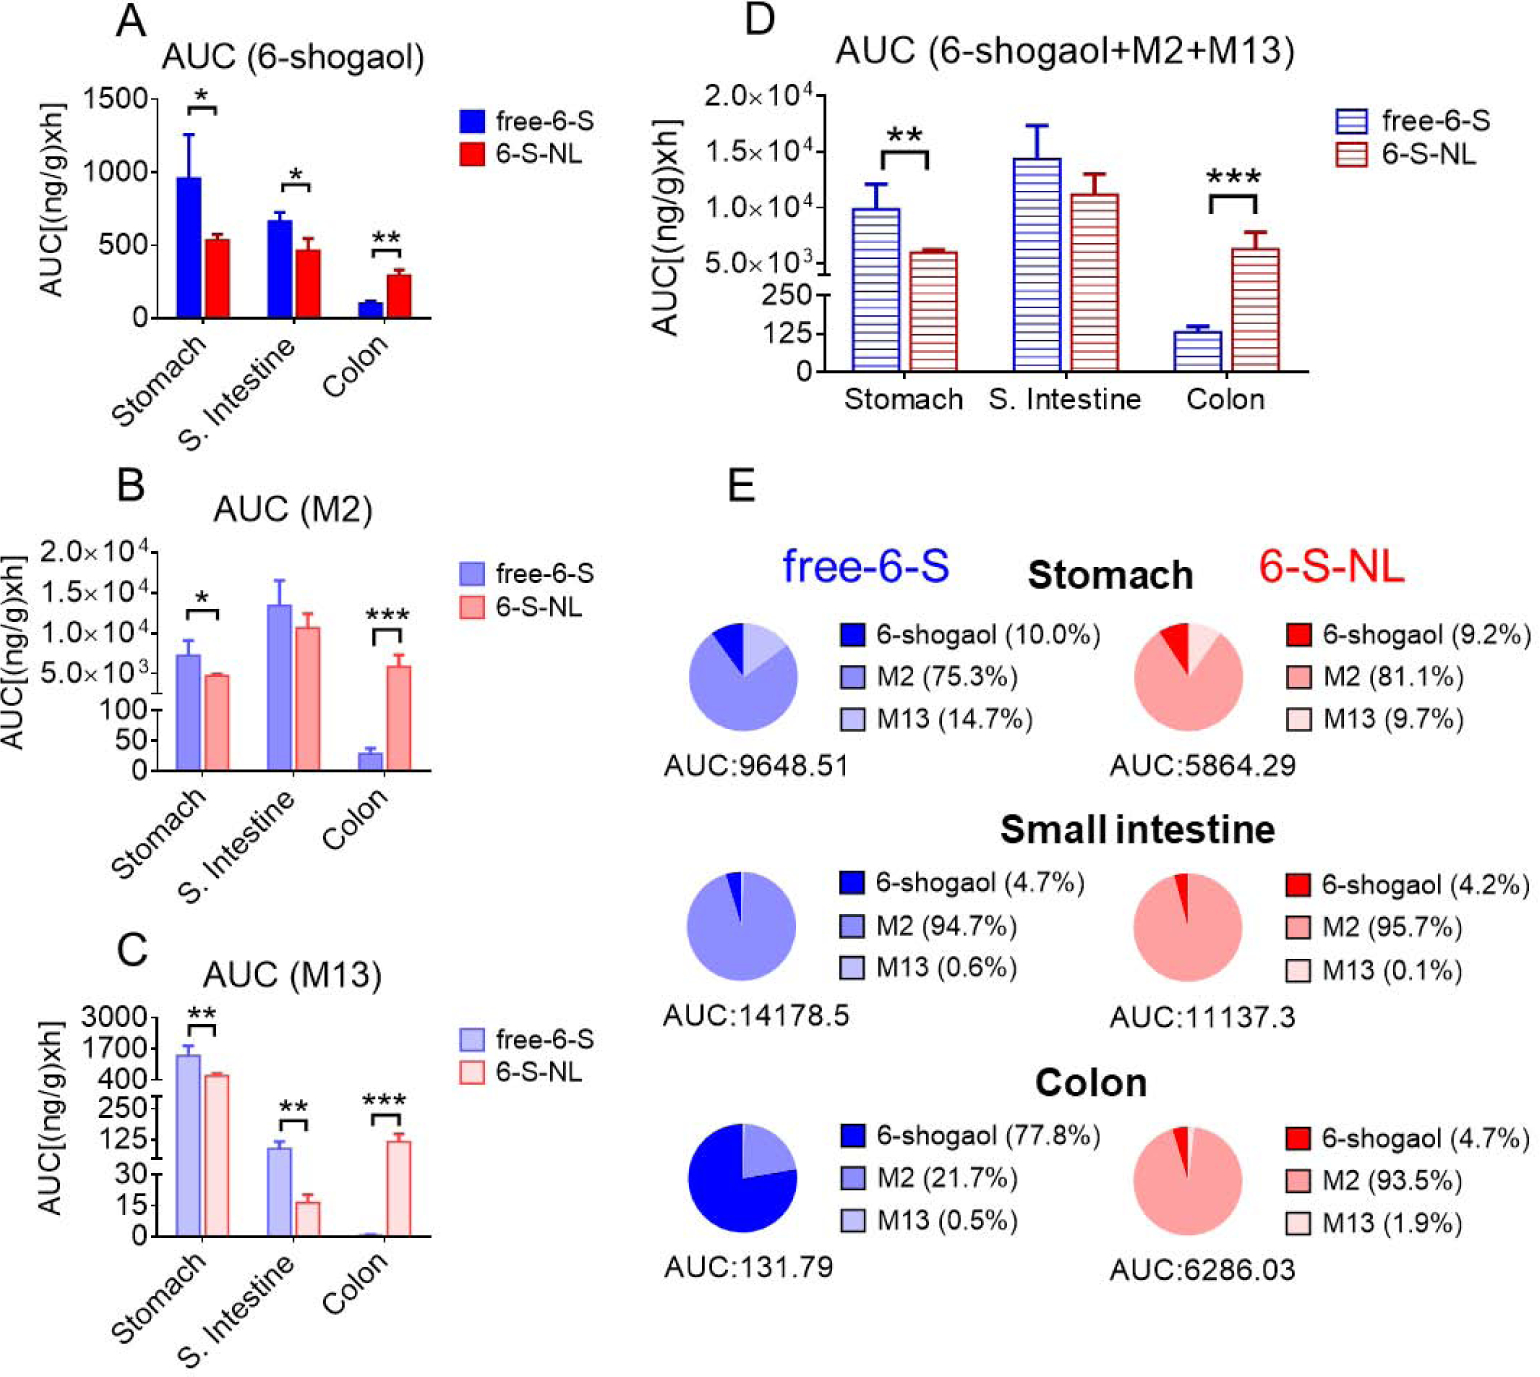
Figure 8. Comparison of drug exposure in the gastrointestinal tract of mice orally administrated with free-6-S and 6-S-NL.

(A) AUC (area under the curve) of 6-shogaol in the gastrointestinal tract (stomach, small intestine, and colon). (n=3) (B) AUC of M2 in the gastrointestinal tract. (n=3) (C) AUC of M13 in the gastrointestinal tract. (n=3) (D) AUC of total active components (6-shogaol, M2, and M13) in the gastrointestinal tract. (n=3) (E) Percentages of 6-shogaol, M2, and M13 in the gastrointestinal tract of free-6-S and 6-S-NL treated mice. (Average, n=3) (*P < 0.05, **P < 0.01, ***P < 0.001)
