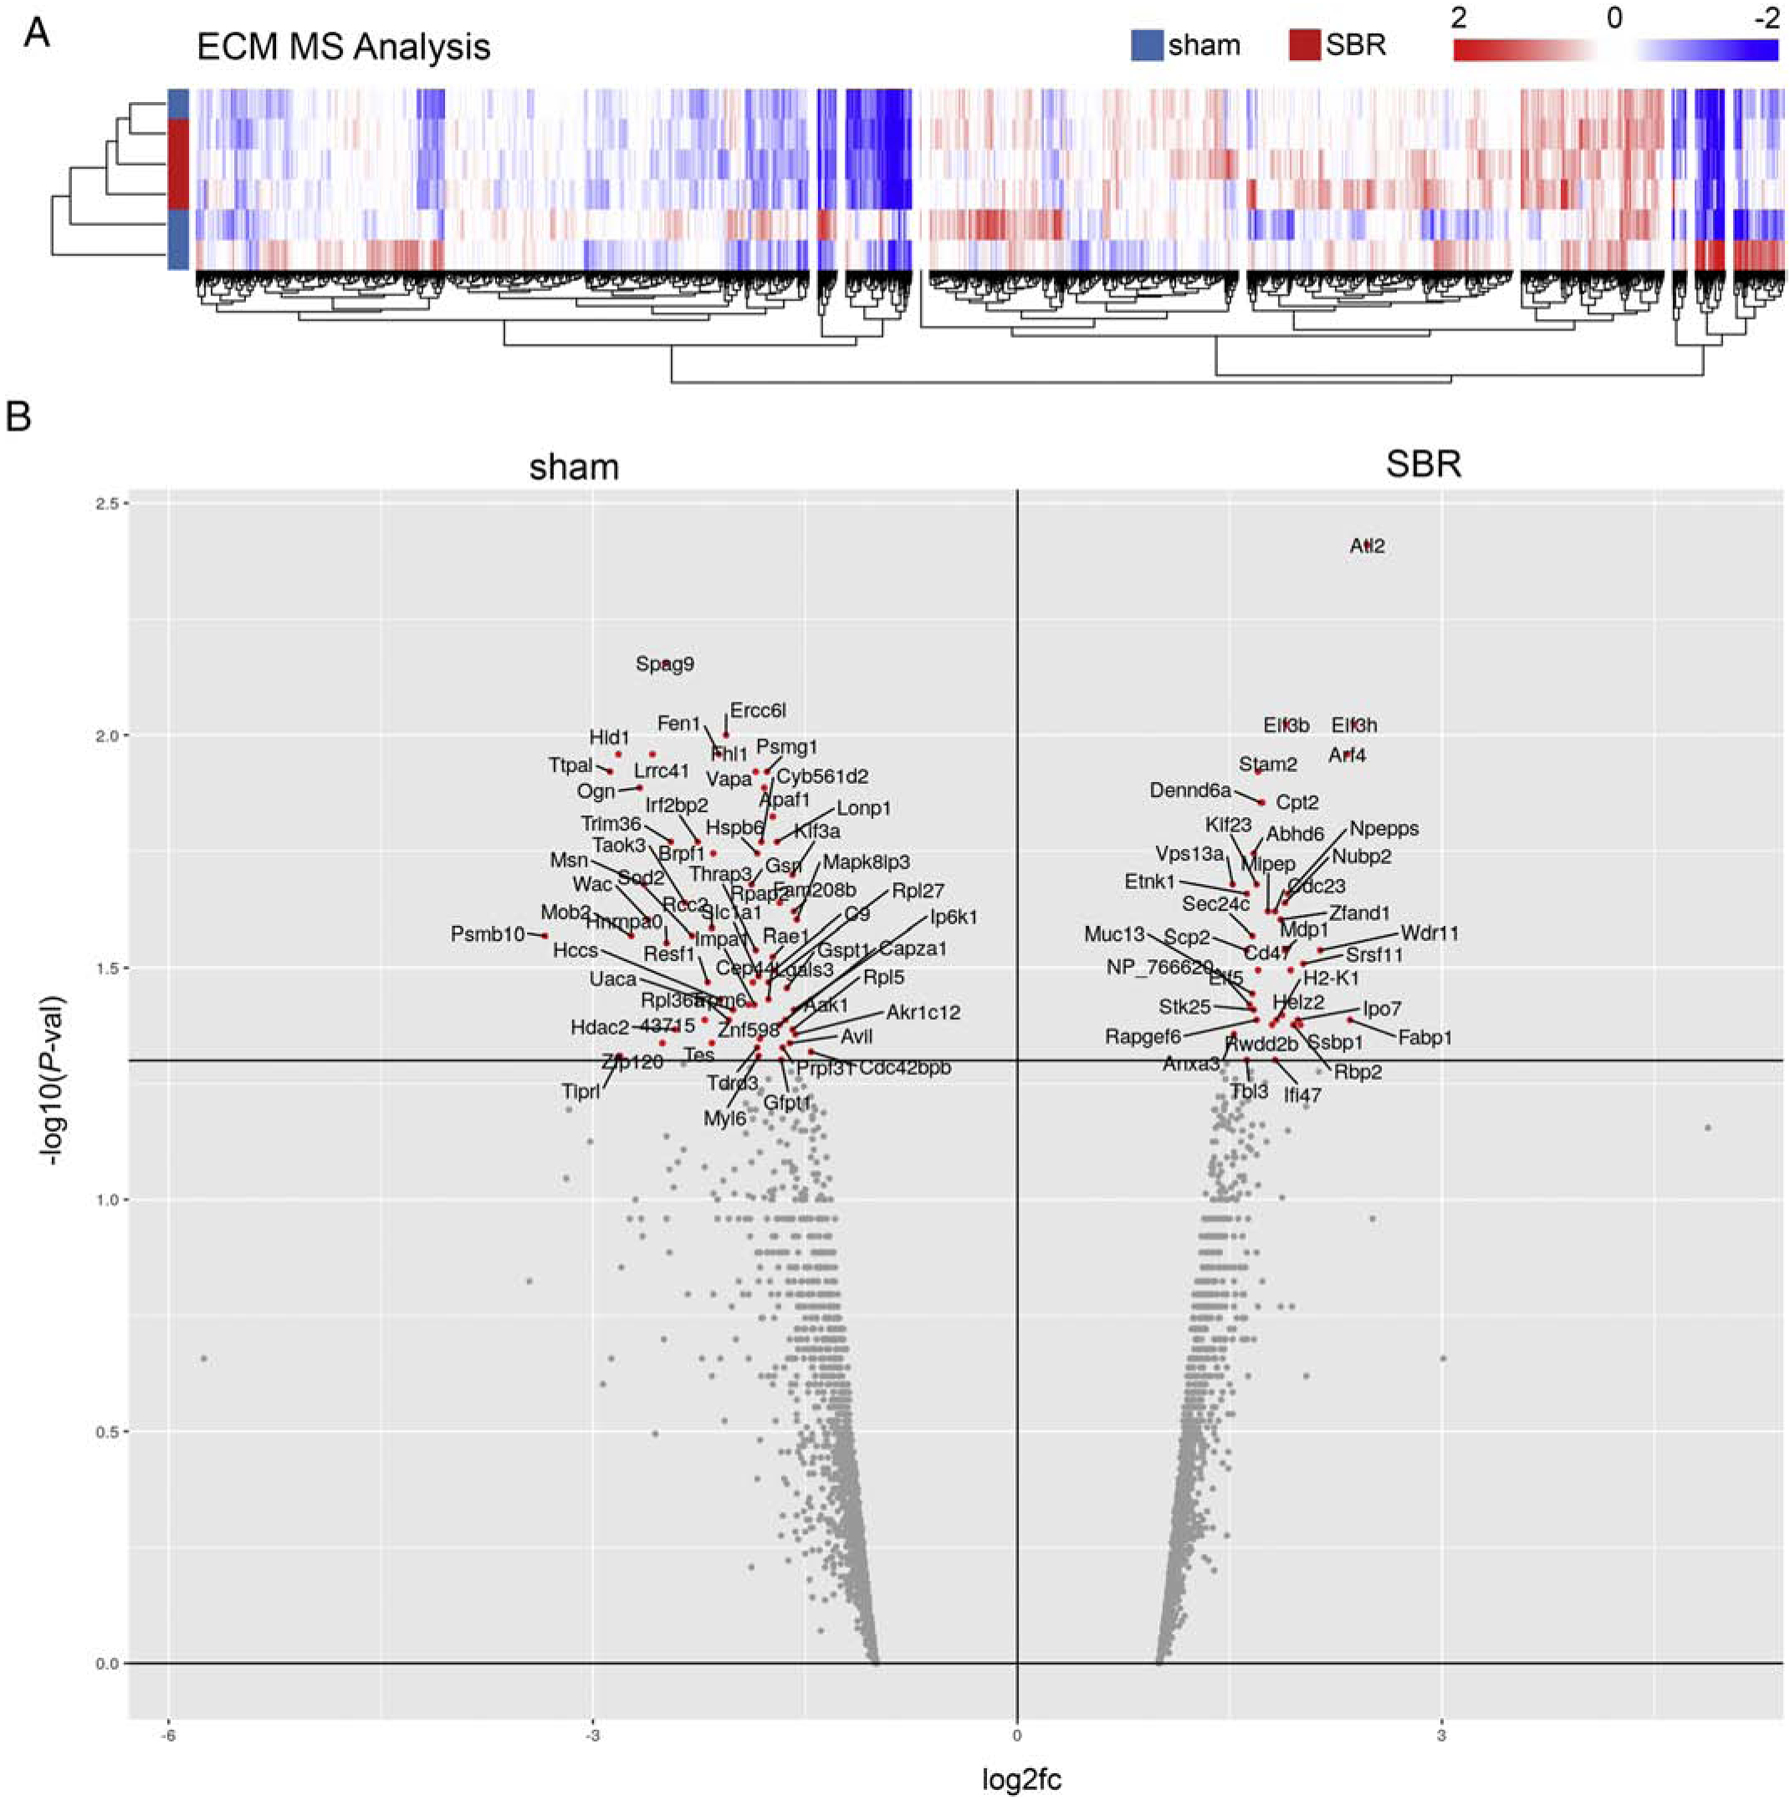
Figure 2.

MS analysis of ECM from sham and SBR ileum reveals differences in composition. A. Heatmap shows protein expression in sham and SBR ECM, with 3034 genes differentially expressed. B. Volcano plotting of differential protein expression with proteins more highly expressed in sham (left) vs SBR (right) ECM. X axis indicates log2 fold-change (fc) in protein expression between the conditions, and Y axis indicates P-value of the expression difference (wherein -log10 P-value of >1.3 corresponds to a P-value of <0.05, as demarcated by bar, above which red data points indicate proteins with a P-value<0.05).
