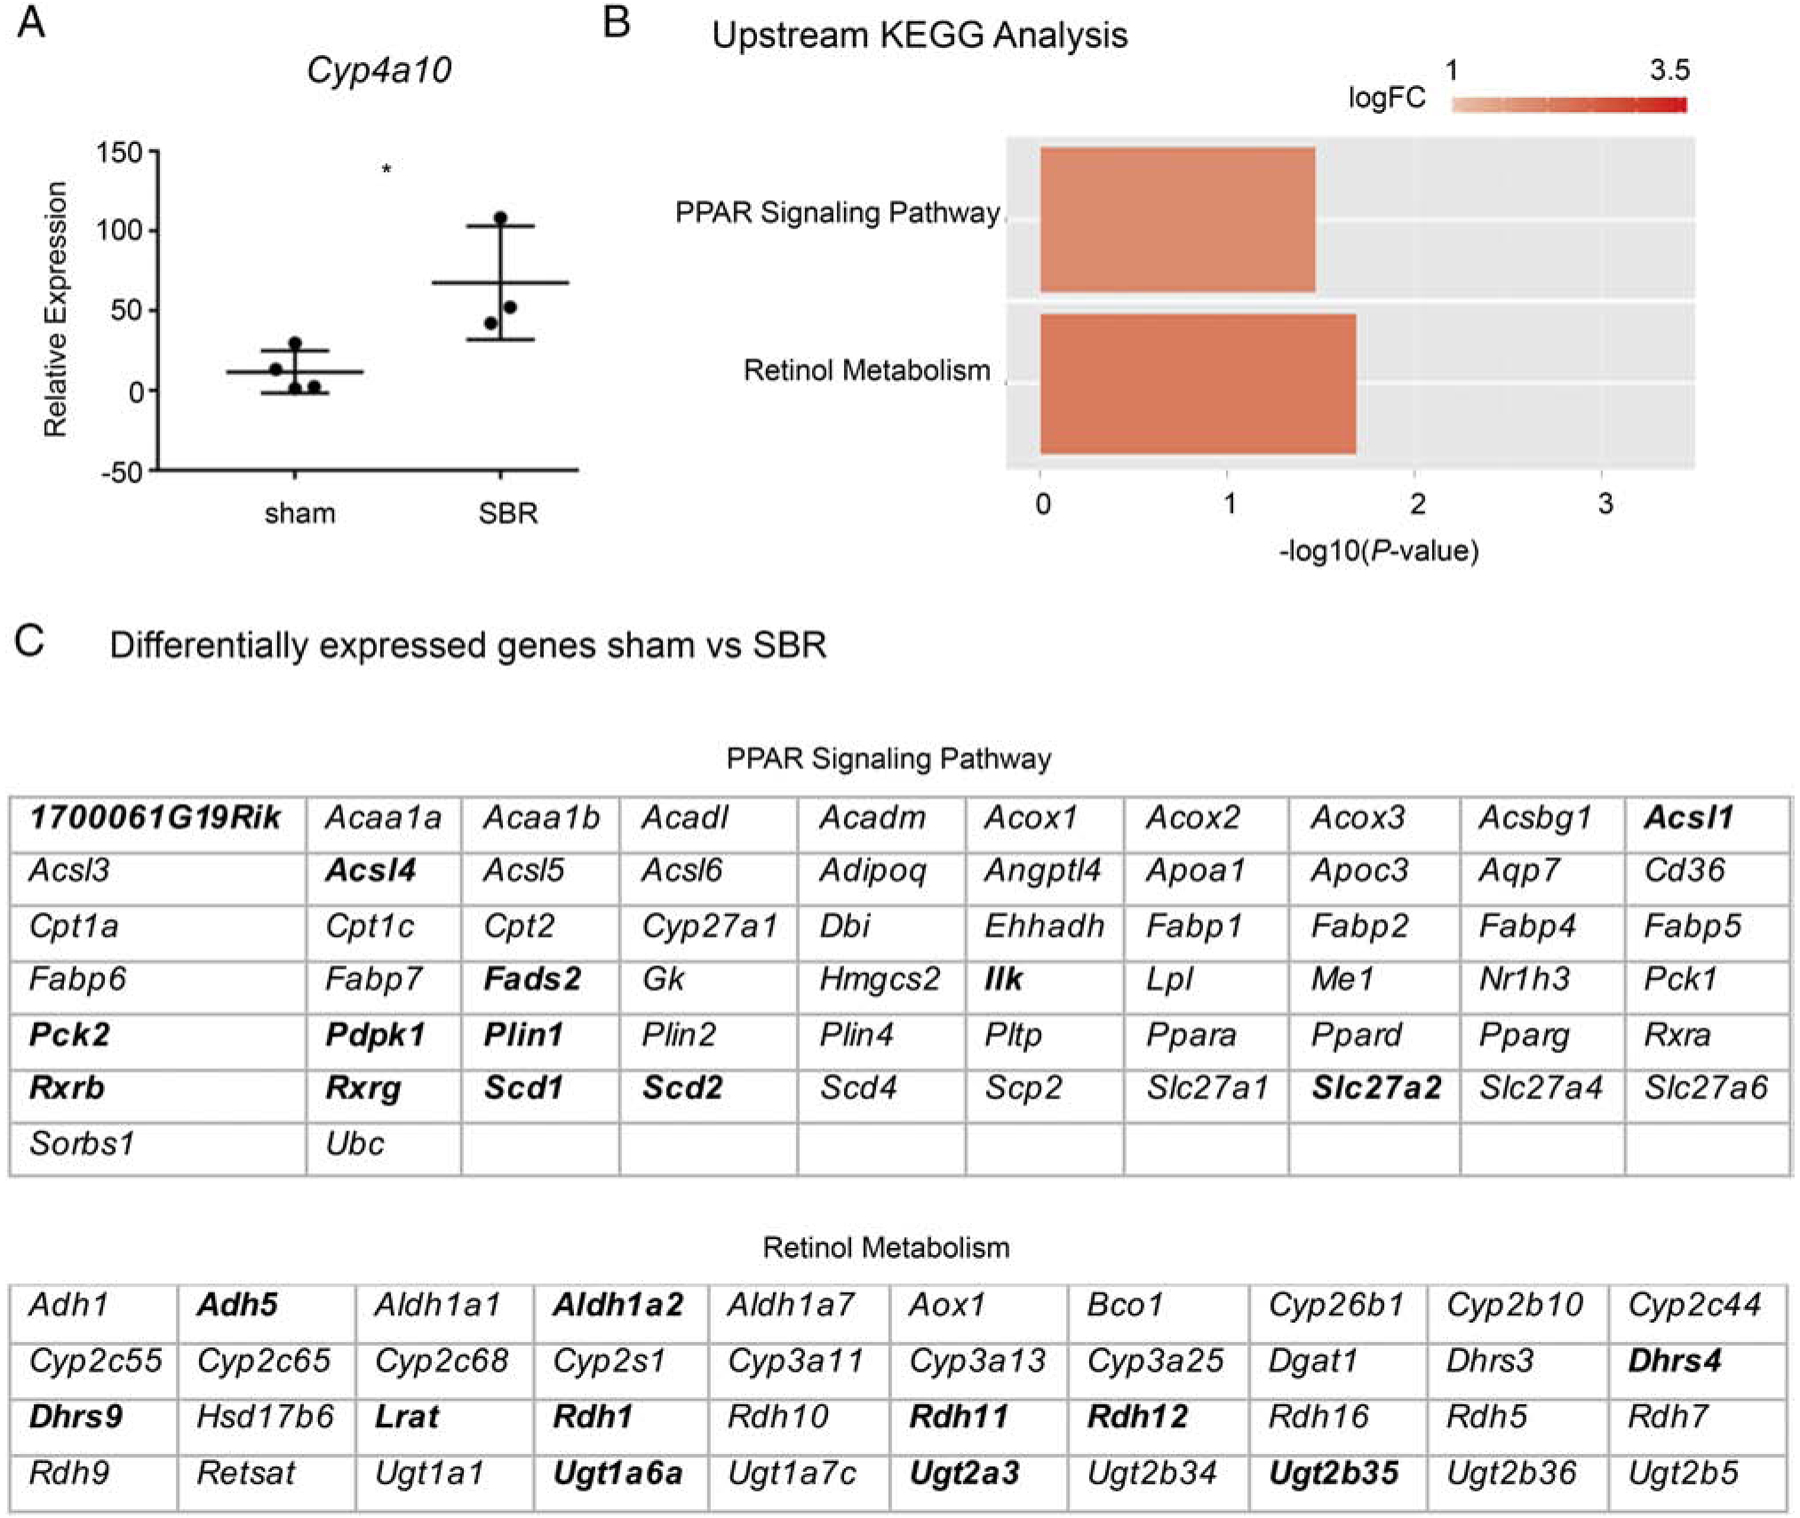
Figure 3.

PPAR signaling is involved in multiple stages of adaptation to SBR. A. qPCR analysis of Cyp4a10 (a downstream indicator of PPAR activation) expression in villus epithelium of sham vs SBR animals (P<0.05). B. KEGG analysis of sub-epithelial tissue at an early time point after surgery reveals perturbed PPAR and retinol metabolism in SBR mice (P<0.05). Y axis indicates predicted perturbed pathways, and X axis indicates P-value of the prediction (wherein - log10 P-value of >1.3 corresponds to a P-value of <0.05). C. Genes that are differentially expressed in the SET of sham vs SBR mice. Bold indicates relatively higher expression in sham, non-bold indicates relatively higher expression in SBR.
