
Extended Data Fig. 4. Sepal cell growth is slower in the drmy1–2 mutant.
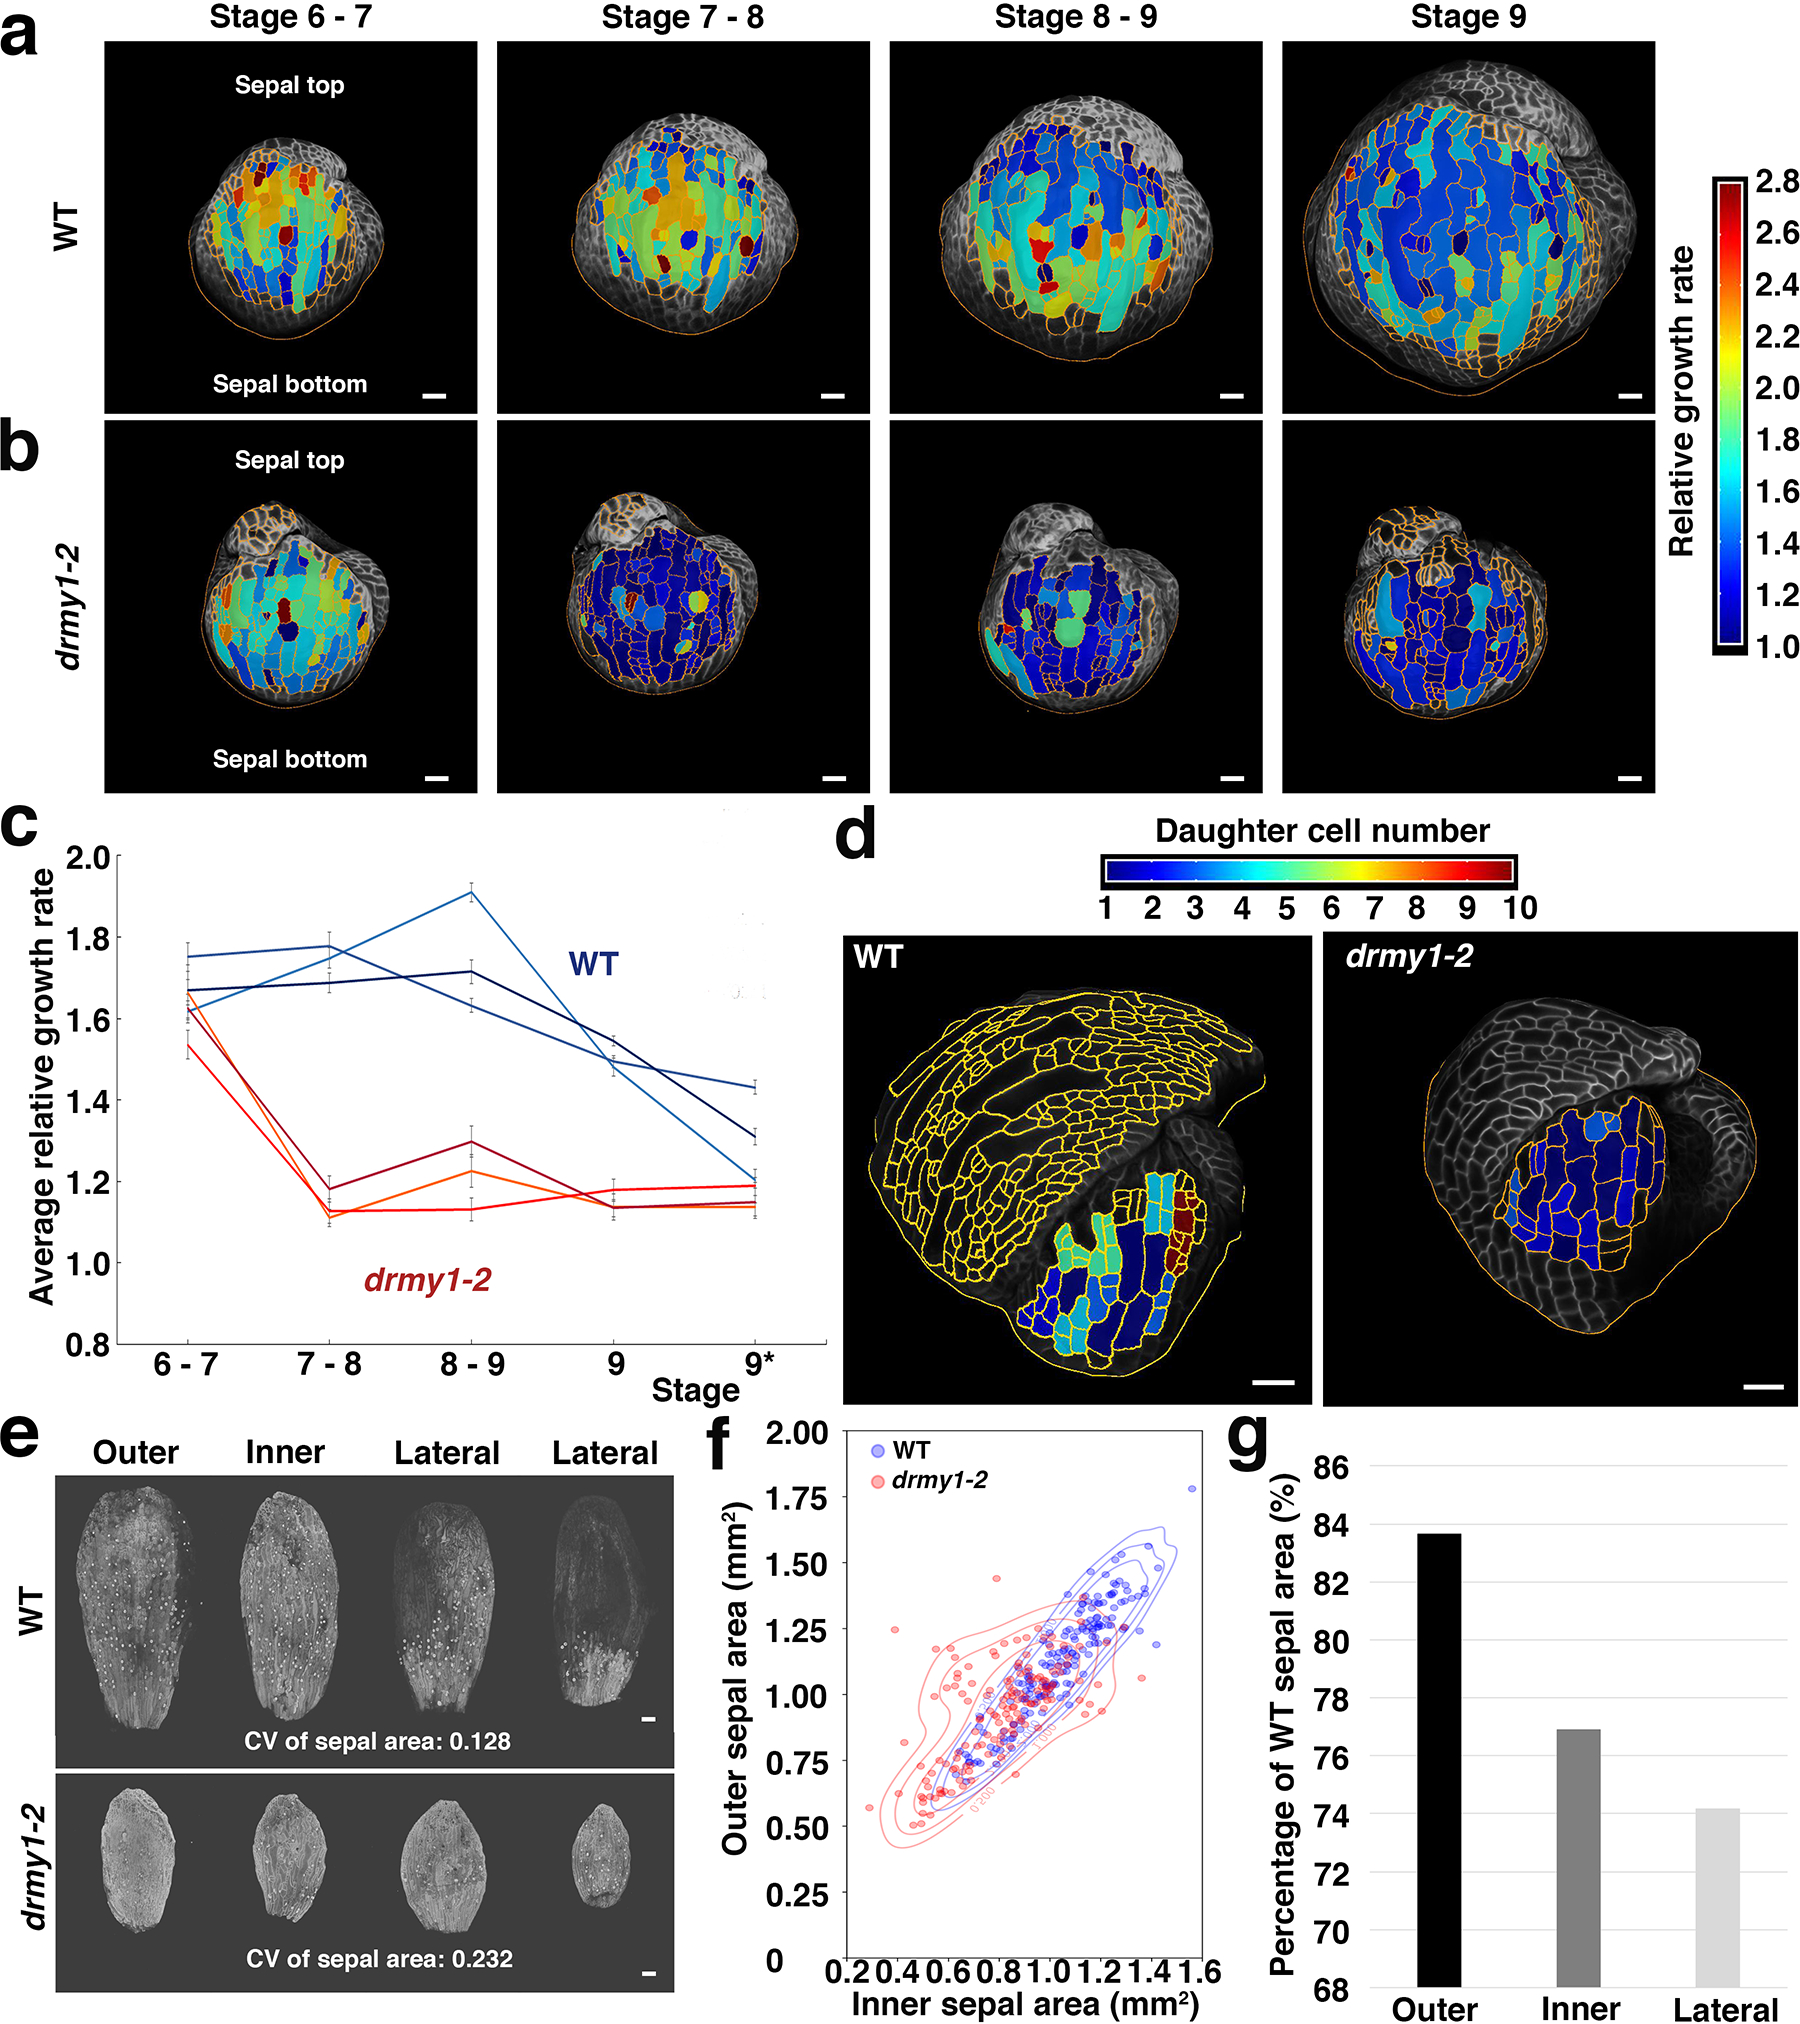
a,b, 24-hour late stage (from stage 6 to stage 9) cellular growth heatmap for both WT (a) and drmy1–2 (b) outer sepals. Relative growth rate is defined as final cell size divided by initial cell size. Segmented cells outlined in yellow. Note the outer sepal base is at the bottom of the image and its tip points up. Scale bars: 20 μm.
c, Growth curves of the late stage average cellular growth for both WT and drmy1–2. *: Flower stage 9 extends over multiple 24-hour intervals. Measure of centre: mean. Error bars represent standard error of the mean. n = 3 flowers.
d, 36-hour cell division heatmap for both WT and drmy1–2. The total number of cells derived from one progenitor is represented in the heatmap with 1 meaning no divisions. Throughout sepal development, the drmy1–2 sepal cells undergo fewer divisions than WT. Scale bars: 20 μm.
e, Confocal images of sepals from individual flowers (shown in Fig. 3a,b) after 11 days of live imaging. Area variability was quantified by the coefficient of variation (CV). Two lateral primordia fused to form the left drmy1–2 lateral sepal. Scale bar: 100 μm. Sepals from 1 flower are shown here, representing 3 live imaging series.
f, The outer sepal area plotted as a function of the inner sepal area in individual flowers. Each color represents a pool of three plants and each point is for one flower (using the same dataset as Fig. 1d and Extended Data Fig. 1b). In addition to plotting the values, we use a Gaussian kernel to estimate their probability density function. We represent the probability density function with labelled contour lines shaping the density. We use a bandwith factor of 0.5, chosen to make the data distribution easier to read. n = 167 WT flowers and n = 148 drmy1–2 flowers.
g, The mean drmy1–2 sepal area divided by WT mean sepal area ratio for each sepal type. Sepals from different flowers were pooled together. n = 48 flowers.