
Figure 3: Tumor-naïve and tumor-informed ctDNA analyses are largely concordant if leukocyte variants are considered.
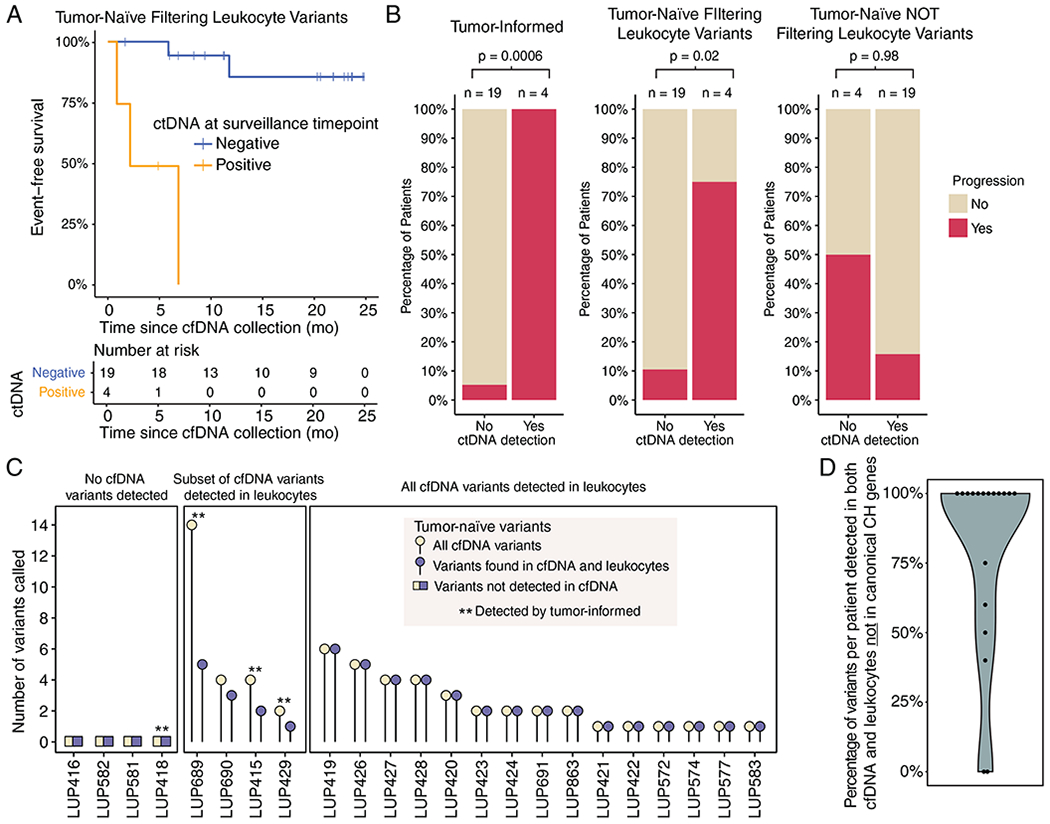
A) Event-free survival after surveillance cfDNA collection in the subset of patients with tumor tissue available using tumor-naïve detection (n = 23). P < 0.0001 (log-rank test).
B) Concordance levels between surveillance sample ctDNA detection status (x-axis) and ultimate progression status (y-axis, colored bars) are depicted as a function of 3 ctDNA genotyping strategies. The tumor-informed strategy (left) demonstrates the best predictive performance (one-sided Fisher’s Exact Test P = 0.0006), followed by the tumor naïve strategy after excluding leukocyte variants (one-sided Fisher’s Exact Test P = 0.02, middle). In the absence of genotyping of leukocyte-derived variants (right), the tumor-naïve strategy fails to significantly predict progression risk (one-sided Fisher’s Exact Test P = 0.98, right). Data are for the same 23 patients with available tumor tissues in other panels of this figure.
C) Relationship between the total number of mutations called by a tumor-naïve strategy (y-axis) in each patient (x-axis), as a function of evidence for mutations in leukocytes (3 large boxes). Patients detected by tumor-informed ctDNA analysis are indicated by the asterisks (n = 4). Data are for the same 23 patients with available tumor tissues in other panels of this figure.
D) Percentage of variants present in both cfDNA and leukocytes that were not in genes previously implicated in clonal hematopoiesis (n = 19).