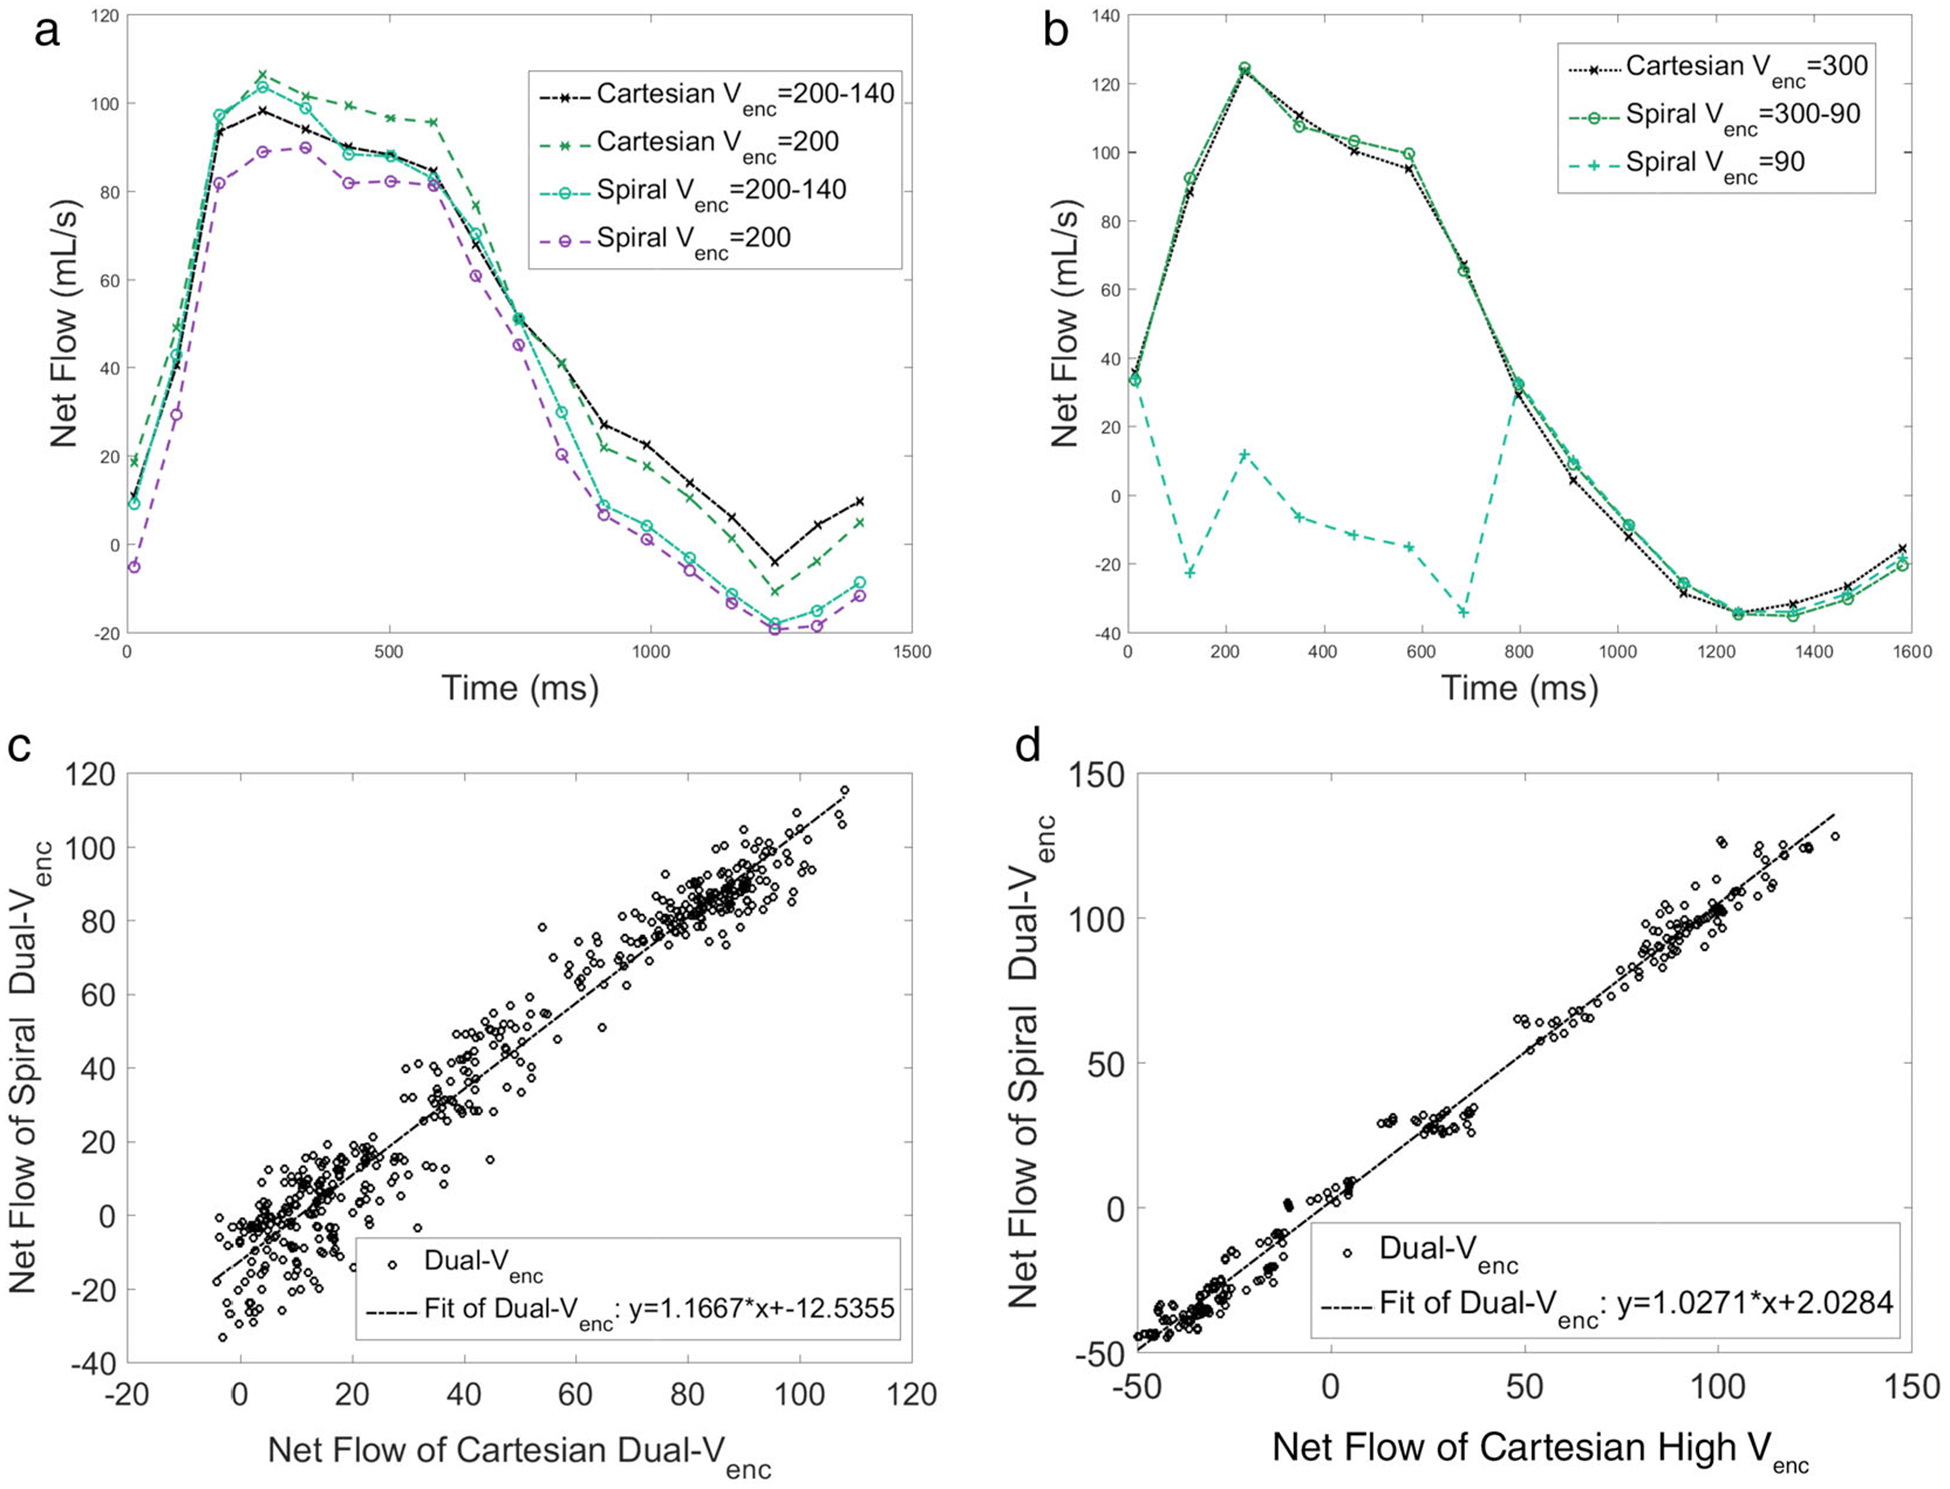
FIGURE 5:

(a) Flow waveform of the aortic arch phantom (Fig. 2c) with a synthetic valve, with 0% occlusion. The slice chosen was 5 mm distal to the valve. (b) Flow waveform in the stenotic phantom (Fig. 2b) calculated from a slice location 4 mm distal to the stenosis throat. Note the Spiral Single Venc waveform is artifactual because of velocity aliasing. In this figure the Single Venc acquisitions are plotted with dotted line, while the Dual Venc results are plotted with a solid line. The Cartesian has a data marker of an x, while Spiral has a circular marker. (c) Comparison of Dual Venc Spiral and Dual Venc Cartesian flow data points for the slice immediately distal to the 50% polymeric valve in the aortic arch phantom. The Pearson correlation coefficient for the scatterplot is 0.975. (d) Comparison of the same Dual Venc Spiral, and High Venc Cartesian in the stenotic phantom. Pearson correlation coefficient for this scatterplot is 0.995. See text for additional description.
