
FIGURE 7:
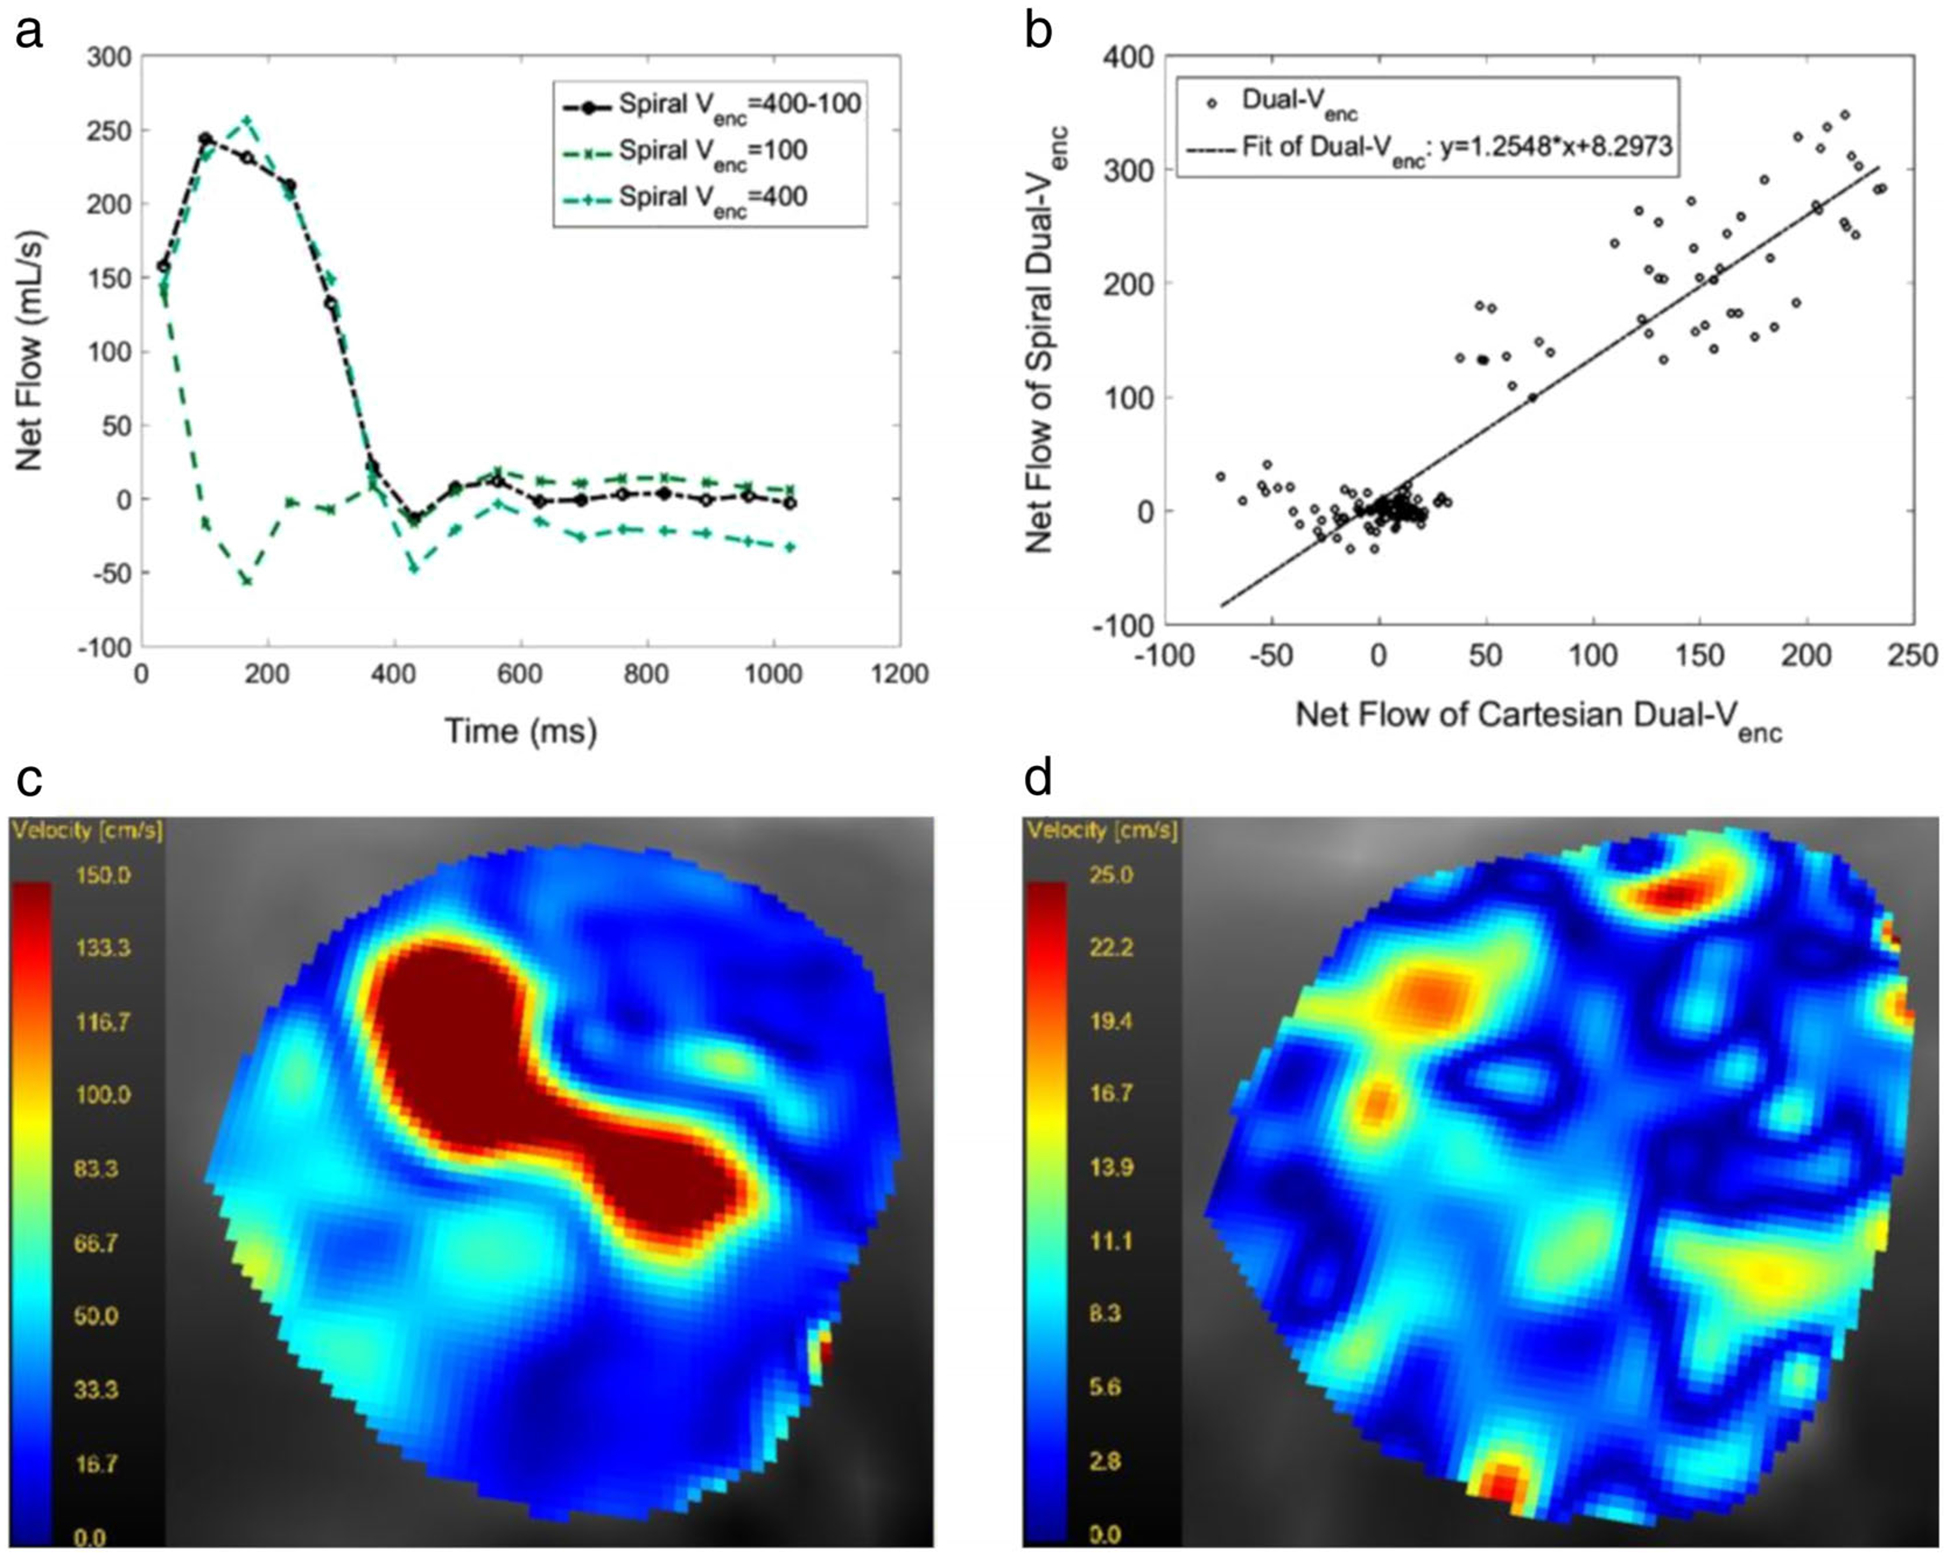
(a) Flow waveform in a patient with severe AS as measured with a Dual Venc, a high Venc and a low Venc spiral acquisition for the entire R-R interval. The TDV was set to 400 msec. Note that the low Venc acquisition leads to velocity aliasing in systole and an artifactual flow waveform. (b) The scatterplot of the Dual Venc vs. High Venc acquisition in the same patient. All slice positions and timepoints were included. The Pearson correlation coefficient was 0.930, (c) (range: 150 cm/s to 0.0 cm/s) and (d) (range: 25.0 cm/s to 0.0 cm/s) show magnitude of velocities in an axial slice at the aortic valve level in the same patient at peak systole and in mid-diastole.