
Figure 2:
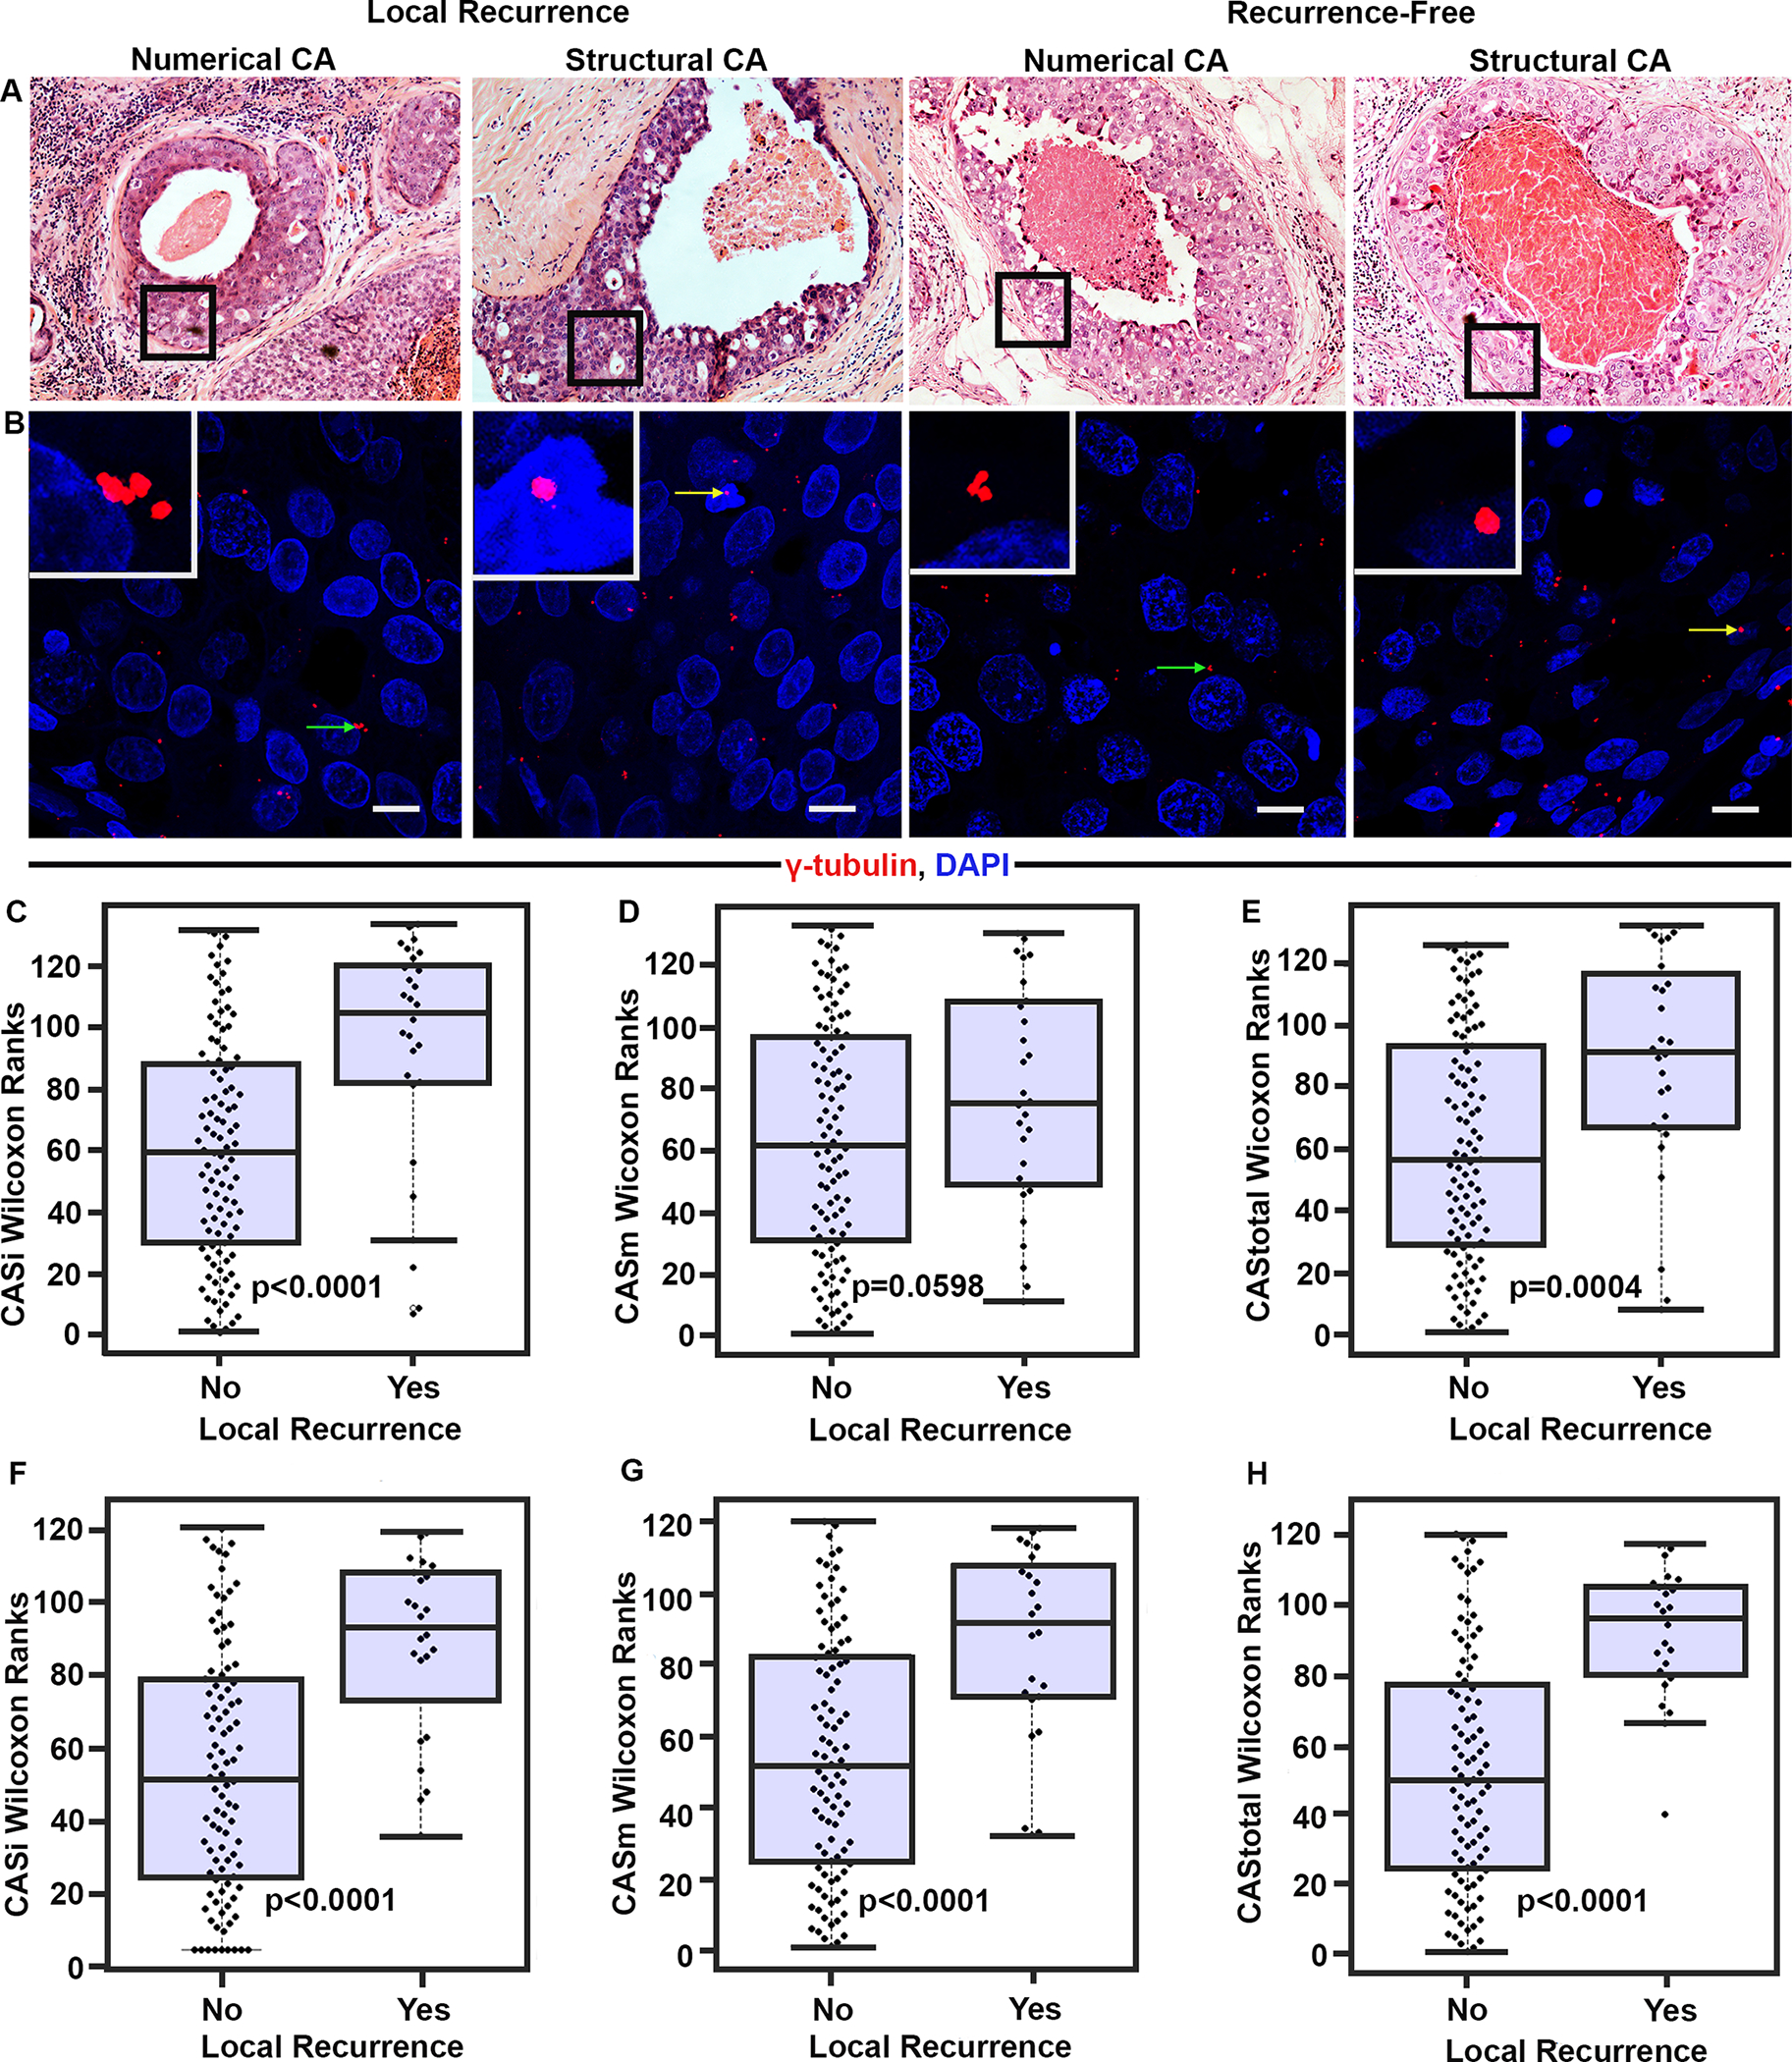
DCIS cases in the DC with ipsilateral recurrence exhibit higher CAS than recurrence-free cases. (A) Representative H&E images (20× magnification) of the ducts from DCIS cases with and without LR. Black boxes represent the area magnified in panel B. (B) Confocal micrographs showing numerical (green arrows) and structural (yellow arrows) CA in DCIS with or without recurrence. Tissue sections were immunostained for centrosomes (γ-tubulin, red) and nuclei (Hoechst, blue). Scale bar (white), 20μm. Beeswarm box plots showing Wilcoxon ranks for pure DCIS cases with LR (n=28) and without LR (n=105). (C) CASi (D) CASm (E) CAStotal. p<0.05 was considered statistically significant. Beeswarm box plots showing Wilcoxon ranks for pure DCIS cases with LR (n=24) and LR-free cases (n=95) in VC (F) CASi, (G) CASm, and (H) CAStotal. p<0.05 was considered statistically significant.