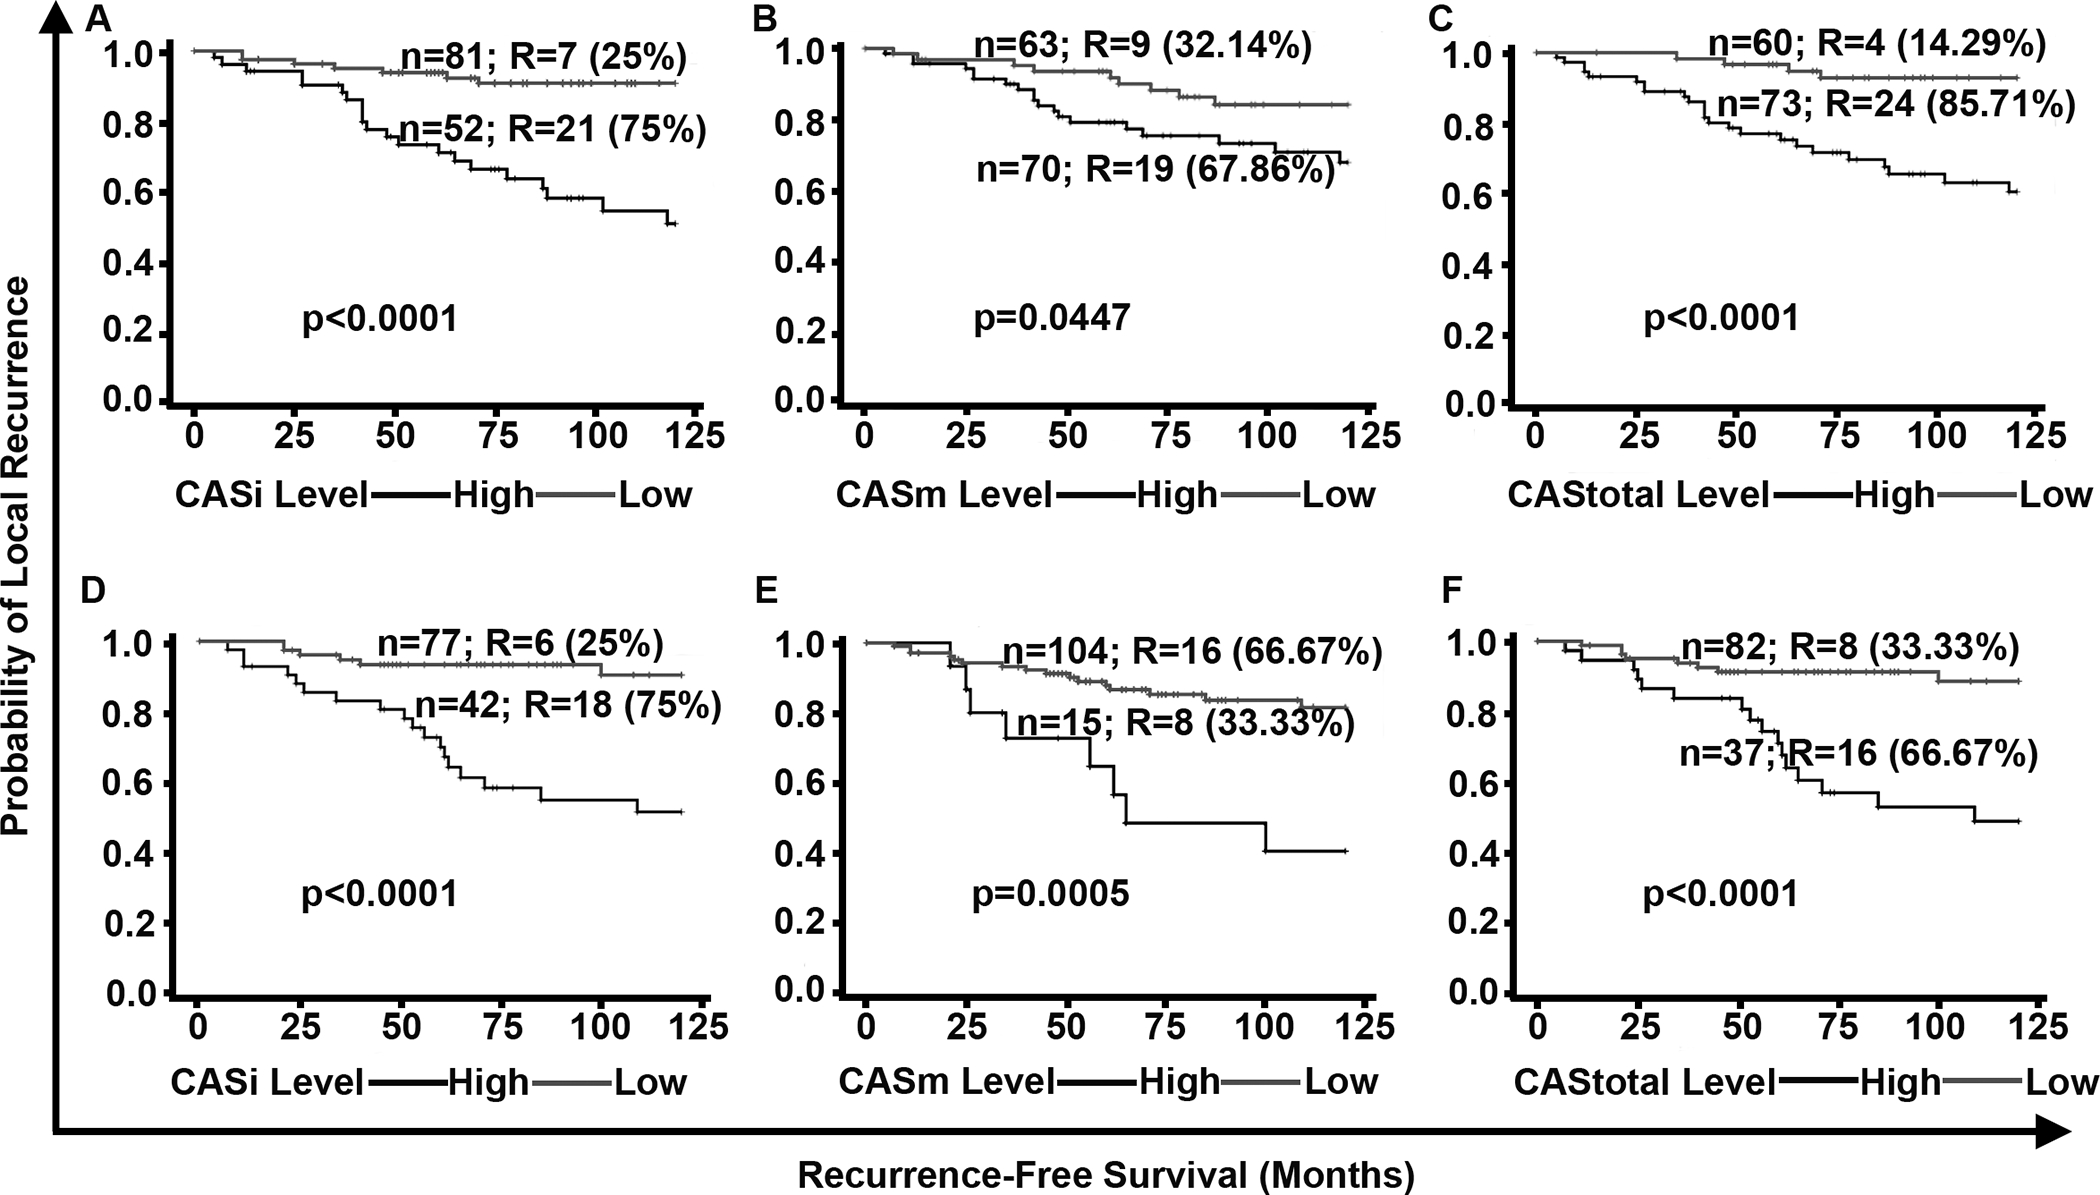
Figure 3:

In the DC and VC, higher CAS is associated with poorer RFS. Kaplan Meier survival curves representing the RFS of patients in the DC stratified into (A) CASi high and low groups, (B) CASm high and low groups, (C) CAStotal high and low groups. Kaplan Meier curves representing the RFS of DCIS patients in the VC stratified into (D) CASi high and low groups, (E) CASm high and low groups, and (F) CAStotal high and low groups. N: total number of patients in each group; R: number of patients who developed LR; % represents the percentage/proportion of patients with LR out of the total number of patients with LR in both groups combined.
