
Figure 4:
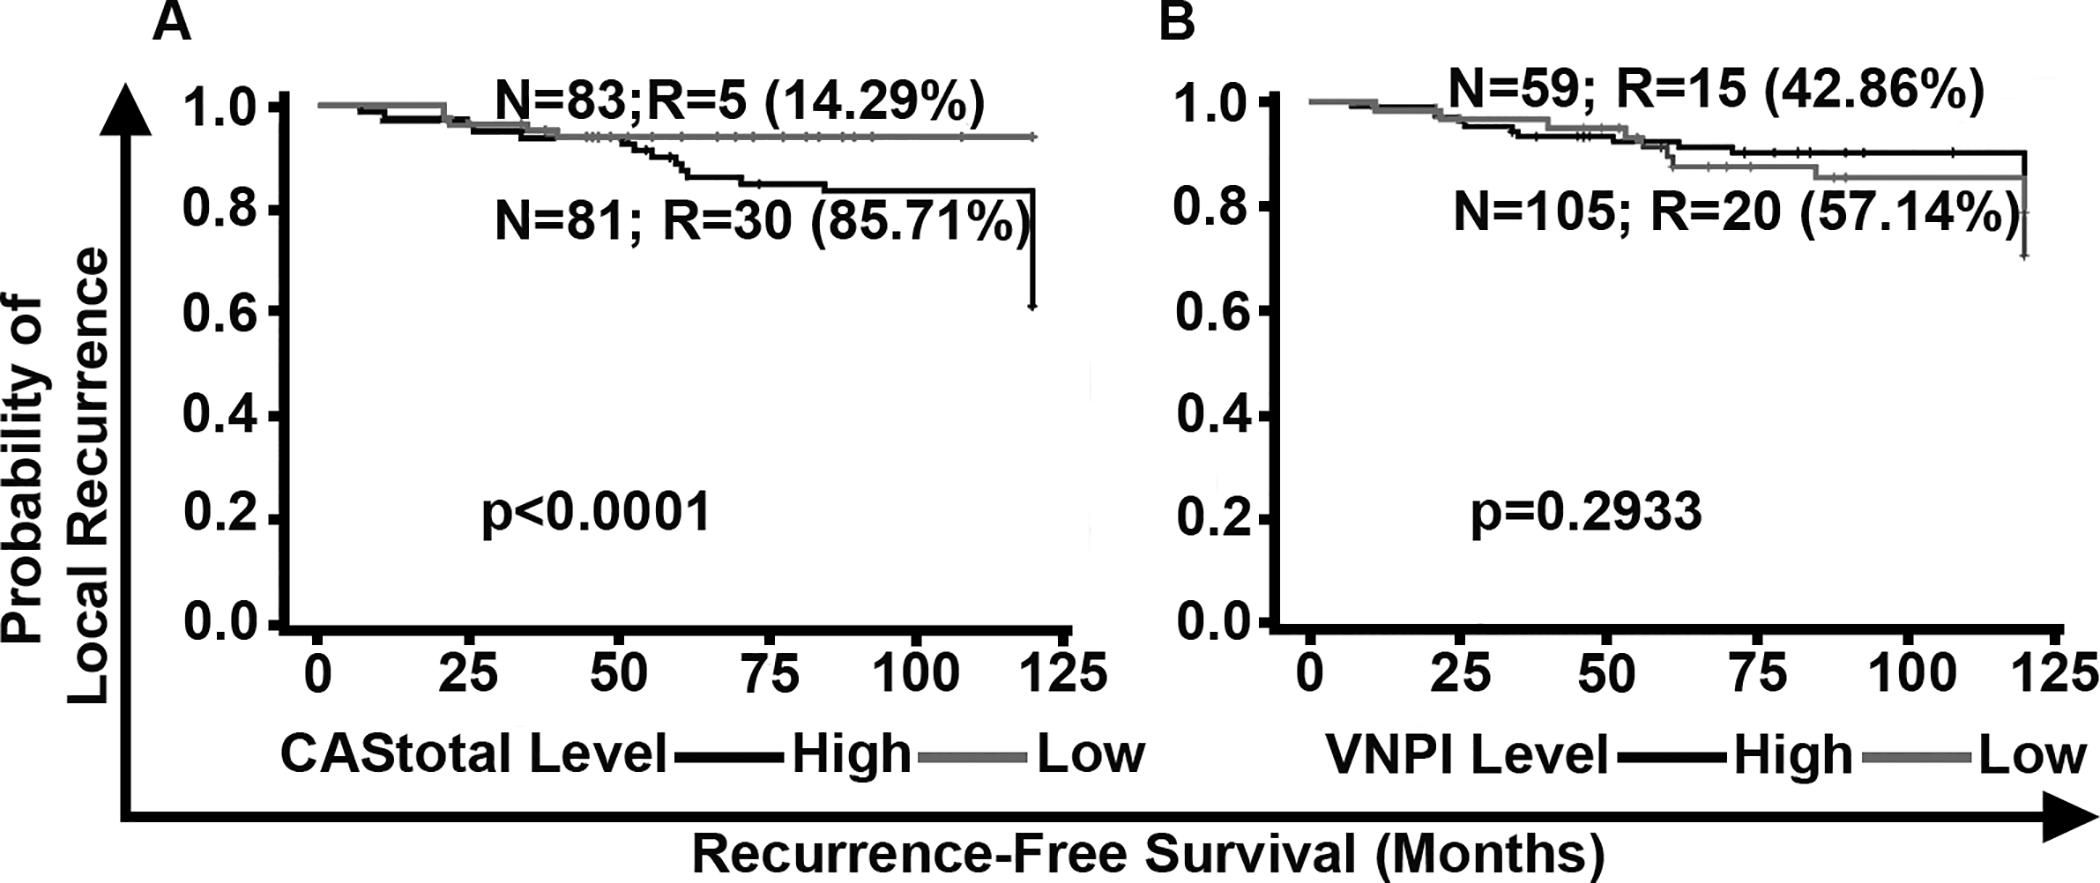
Comparison of the stratification of DCIS patients by CAStotal and Van Nuys Prognostic Index (VNPI). Kaplan Meier survival curves representing the RFS of DCIS patients (n=164) stratified by (A) CAStotal, and (B) VNPI. N: total number of patients in each group; R: number of patients who showed LR; %: percentage/proportion of patients with LR out of the total number of patients with LR in the DC and VC combined.