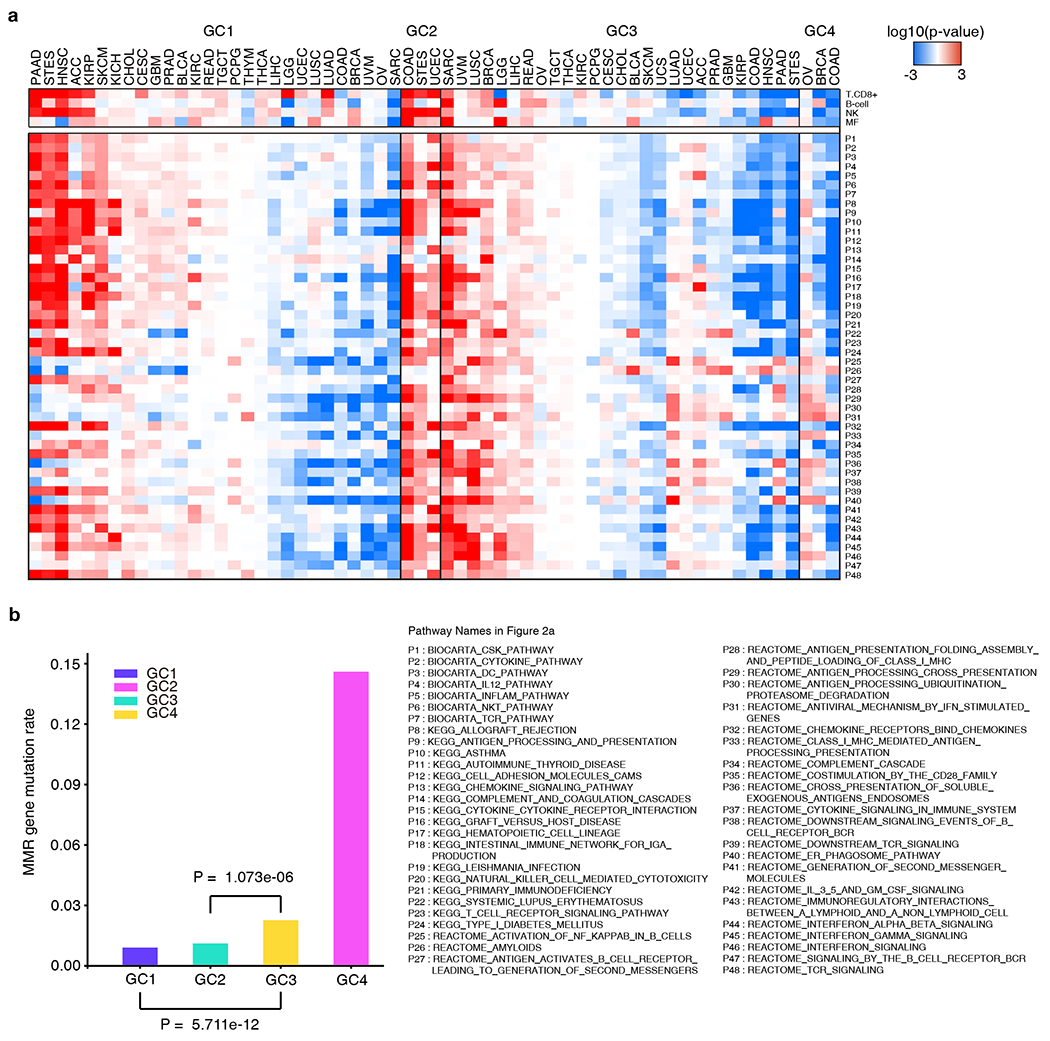
Figure 2.

Immune profile and objective response rate (ORR) comparisons between GCs. a, Comparison of expression of immune pathways between GCs. Expression of immune pathway comparisons between samples of a given cancer type in a specific GC and samples of the same cancer type not in that GC. Color intensities in boxes represent the log10(FDR) calculated by GSEA, red color indicates high expression and blue color indicates low expression. b, Mismatch repair gene mutation frequency of each GC. The mutation frequency of the MMR genes (MLH1, MLH3, MSH2, PMS2, MSH3, MSH6, MSH4, PMS1) is calculated as the number of mutation events in a GC divided by the product of the number of MMR genes and the sample size of this GC. P value was calculated using Chi-square test comparing the mutation frequency of MMR genes in one GC to another.
