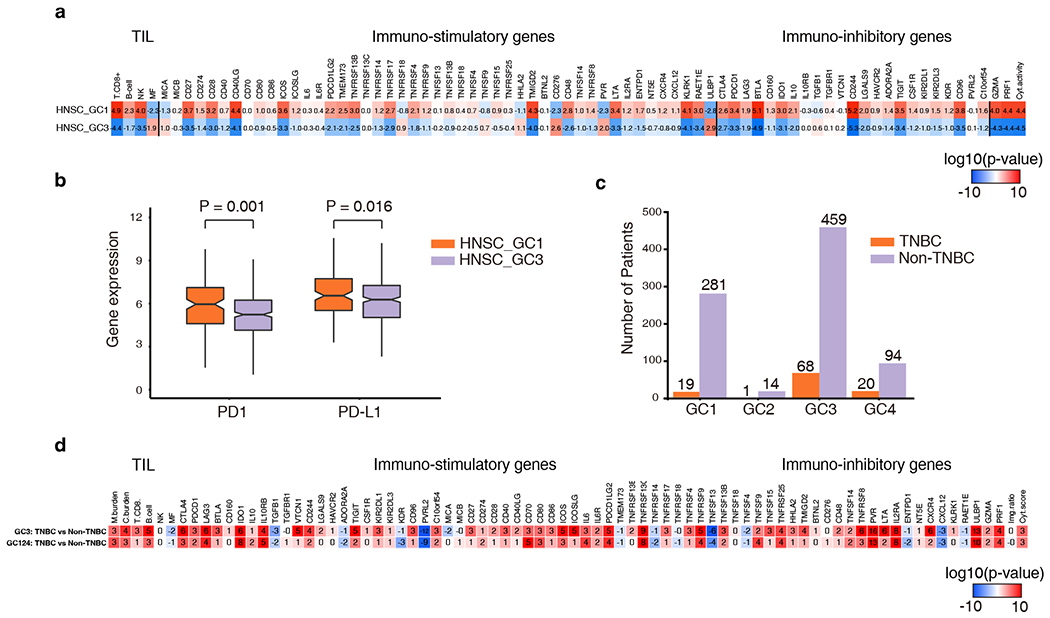
Figure 3.

Comparisons of GC tumor immune profiles of the head and neck cancer (HNSC) and the triple negative breast cancer (TNBC). a, Immune profile difference between HNSC GC1 and HNSC GC3. Numbers in boxes represent the log10(p-value) calculated from a Wilcoxon test comparing the given immune feature between each group of samples. The higher red intensity and positive numbers indicate a more significant level of enrichment while the higher blue intensity and negative numbers indicate a more significant level of depletion. b, PD1 and PD-L1 expression of HNSC GC1 and HNSC GC3. Gene expression is measured as the log2 expected count quantified by RSEM. P value was calculated by the Wilcoxon test. c, The distribution of TNBC and non-TNBC in each GC. Fisher’s exact test was used to compare the fraction of TNBC in one GC to other GCs. TNBC GC1 was significant depleted (p <0.001), and TNBC GC3 and TNBC GC4 were significant enriched (p = 0.05, p = 0.02 respectively). d, Immune profile difference between TNBC and Non-TNBC in GC3 and other GCs. Numbers and colors are similar as these in a.
