Fig. 3.

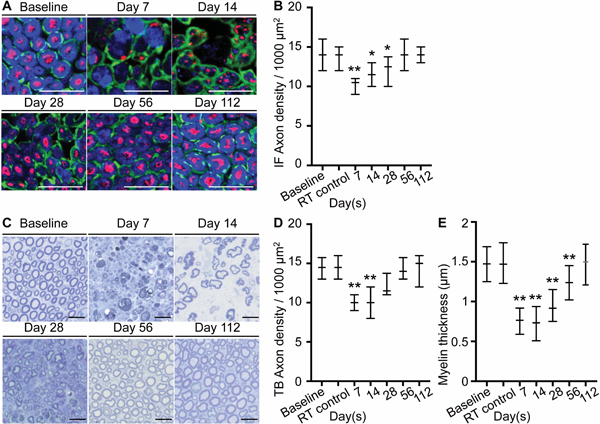
Ice slurry induces reversible decrease in axon density and myelin thickness. (A) Immunofluorescence staining shows preservation of S100 positive Schwann cells (green) and loss of MBP positive myelin (blue) and NF200 positive axons (red). (B) Graph shows quantification of axon density as shown in A, expressed as axons/1000μm2 at day 7, 14, 28,56, and 112 after injection of slurry and at day 7 after injection of control room temperature solution (RT control). n=20 hpf from 2 animals per group per time point. (C) Representative image of nerve sections stained with toluidine blue. (D) Graph shows quantification of axon density as shown in C, expressed as axons/1000μm2. n=20 hpf from 2 animals per group per time point. (E) Graph shows myelin thickness of axons stained with toluidine blue. n=292 nerve fibers in 20 hpf from 2 animals at baseline, n=285 nerve fibers in 20 hpf from 2 animals in RT control group, n=203 nerve fibers in 20 hpf from 2 animals at day 7, n=214 nerve fibers in 20 hpf from 2 animals at day 14, n=245 nerve fibers in 20 hpf from 2 animals at day 28, n=287 nerve fibers in 20 hpf from 2 animals at day 56, n=287 nerve fibers in 20 hpf from 2 animals at day 112; Data are presented as median with interquartile range. * P < 0.05, ** P < 0.001 compared to baseline by Kruskal-Wallis followed by Dunn’s multiple comparisons test; scale bars: 20 μm; RT, room temperature; IF, immunofluorescence.
