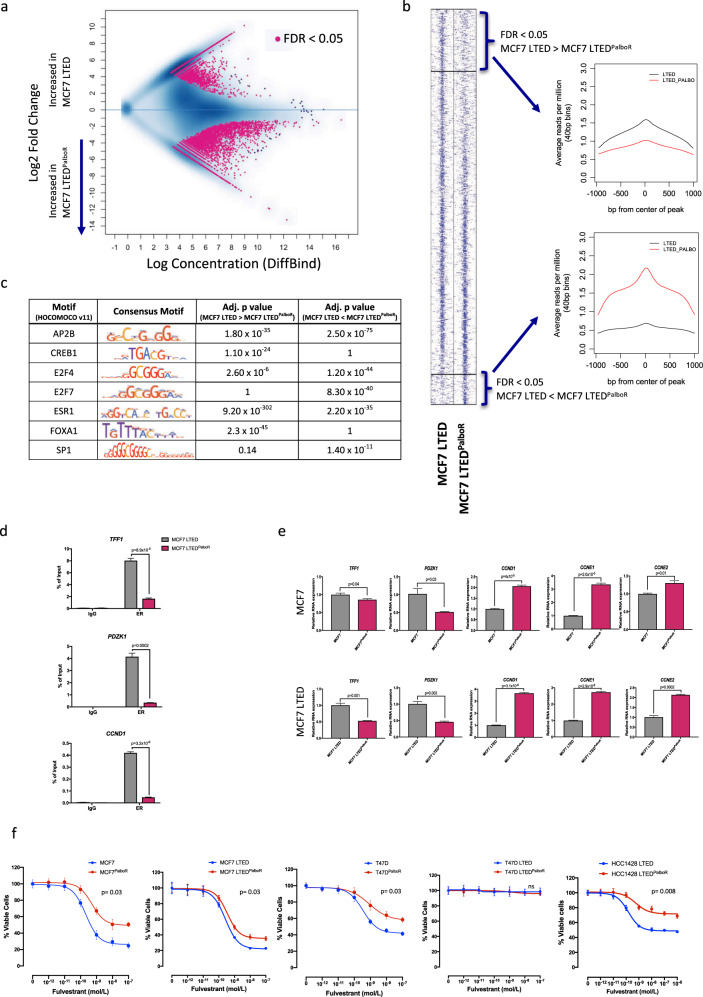
Fig. 3. Resistance to palbociclib associates with downregulation of ER-classical activity assessed by ChIP-seq.
a MA plot showing the differential binding affinity of ER. The x-axis shows log concentration of sequenced tags per peak; y-axis represents log2 fold change of MCF7 LTED/ MCF7 LTEDPalboR (n = 3 biological replicates). b Heatmap depicting binding peak intensities, which are common or different between the two cell lines. The window represents ±1 kb regions from the centre of the binding event. c Motif analysis of common and augmented ESR1 peaks from MCF7 LTED versus MCF7 LTEDPalboR. d Effect of palbociclib resistance in recruitment of the ER to TFF1, PDZK1 and CCND1 promoters. Error bars represent means ± SEM. (n = 2 biological replicates). e Effect of palbociclib resistance on expression of TFF1, PDZK1, CCND1, CCNE1 and CCNE2 in MCF7 and MCF7 LTED cell lines. Error bars represent means ± SEM. f Effect of escalating concentrations of fulvestrant on the proliferation of MCF7, MCF7 LTED, T47D, T47D LTED and HCC1428 LTED and their corresponding palbociclib (PalboR) resistant cell lines. Data represents % viable cells compared with vehicle control for each cell line. Error bars represent mean ± SEM.

