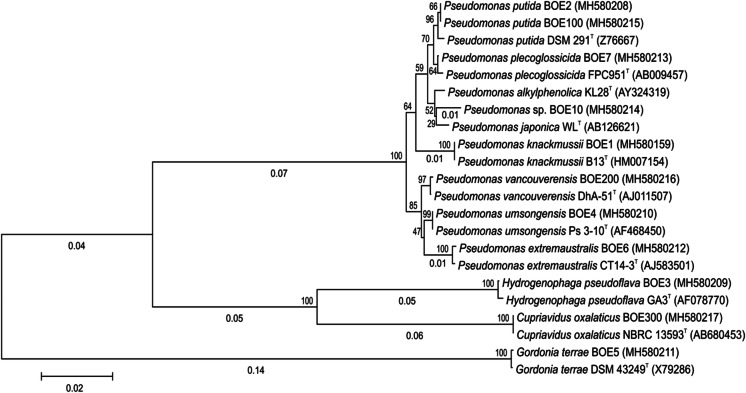
Fig. 3.
Phylogenetic tree constructed by the Neighbor-Joining method (Saitou and Nei 1987) based on the 16S rRNA gene sequences of the isolated strains and closely related type strains (T). GenBank accession numbers are presented in parentheses. The percentage of replicate trees in which the associated taxa clustered together in the bootstrap test (1000 replicates) is shown next to the nodes. The tree is drawn to scale, with branch lengths (below the branches) in the same units as those of the evolutionary distances used to infer the phylogenetic tree. The evolutionary distances were computed using the Maximum Composite Likelihood method (Tamura et al. 2004) and are in the units of the number of base substitutions per site. The scale bar represents 0.02 substitutions per nucleotide position. There were a total of 1265 positions in the final dataset. Evolutionary analyses were conducted in MEGA7 (Kumar et al. 2016)

